Wednesday 10 June 2015

Cross-posted on the DoubleClick Advertiser Blog

Modern marketers live in a world that’s dominated by data. Advancements in programmatic buying enable marketers to leverage data and analytics to connect precisely, in real time. Advertisers who are smart about organizing, segmenting, and acting on this data are realizing the benefits of more personalized marketing. BT, a leading telecommunications firm in the UK, did just that and saw fantastic results.  

BT wanted to increase the relevance of their remarketing campaigns by creating more precise audience lists. With the help of their media agency Maxus, BT found that using Google Analytics Premium with DoubleClick Bid Manager offered the ideal solution. 

Google Analytics Premium gave BT the ability to create granular audience segments based on site behavior metrics such as recency, frequency, referral source, and stage of cart abandonment. Once these audience lists were created, the native integration between Google Analytics Premium and DoubleClick Bid Manager meant they could be shared with the platform to make more precise media buys in just a few clicks.

Using Google Analytics Premium with DoubleClick Bid Manager put Maxus and BT in the driver’s seat of their media campaigns. They not only gleaned full transparency with a single customer view and de-duplicated metrics across all channels, but also saw better measurement through unified reporting, and the ability to optimize based on the results.


”Our goals were to build up ‘best practices’ of programmatic display remarketing techniques with a focus on driving post-click sales,” says Alison Thorburn, Head of Digital DR Media at BT. “The DoubleClick suite of products enabled us to do this quickly and efficiently as audience data can be easily organized and utilized.” 

The new analytics-driven approach produced a 69% increase in post-click sales and an 87% reduction in post-click cost per acquisition compared to the previous year’s remarketing activity. It also compared favorably to the remarketing activity that ran simultaneously outside of DoubleClick Bid Manager; post-click sales were 30% higher and post-click cost per acquisition was 42% lower. BT has now consolidated its display remarketing through DoubleClick BidManager.
Read the full case study here.

Posted by-
Kelley Sternhagen, Product Marketing, Google Analytics
Kelly Cox, Product Marketing, DoubleClick

Friday 5 June 2015

Well, SES San Jose 2006 is over, and we had a great time meeting all
of you who stopped by the Google Analytics booth and attended the Google
Dance. Yesterday, there was a panel called "Vendor Chat On
Measuring Success" which included our own Brett Crosby, Senior
Product Marketing Manager for Google Analytics and co-founder of
Urchin. Each of the vendors on the panel were asked to discuss the
various approaches to measuring a website's success -- from
conversions to ROI, from customer inclusion to the idea of
"persuasion" in a discussion of marketing success.

Before the Q & A period, each panelist had five minutes to identify
the most important issue in web analytics. According to Brett, "The
most important thing about web analytics is something our product
doesn't do. And none of the other products do it either."

What is that crucial thing? It's analyzing and then taking action on
your web analytics data. Knowing how to do that makes all the
difference. To properly monitor and analyze your data, Brett suggested
doing one of three things (or some combination of them): analyze
and act on the data yourself; hire a professional services firm; or
hire an in-house analyst.

Regardless of which you choose, you have incredible flexibility with
Google Analytics. If you hire an in-house analyst or if you analyze
the data yourself, you've got many resources including this blog, the
Conversion University, the Help Center, built-in product Help,
and the Google Group. For those who want to hire a professional
services firm, we've got a world class international network of Google
Analytics Authorized Consultants.

We really enjoyed meeting you and look forward to connecting with
even more people using Analytics in the future. Please let us know if
there's anything else you'd like to see from support or marketing or
even from this blog by shooting us an email.

Friday 29 May 2015


The American Precious Metals Exchange (APMEX) is the leading purveyor of precious metals, serving millions of customers worldwide. The company partnered with E-Nor, a Google Analytics Premium Authorized Reseller, to better understand the customer journey and gain insights to improve marketing initiatives.


The first challenge they tackled was to integrate various data assets by exporting Google Analytics Premium data to Google BigQuery. This was accomplished using both the BigQuery export and the User ID features to connect website behavioral data to the company internal customer profiles. This enabled APMEX to use data more effectively to interact with different types of customers.

In addition, by bringing Google Analytics data into the company’s Customer Relationship Management (CRM) system, they empowered their internal teams to make data-informed decisions on a daily basis. For example, when customers call, site usage information is now available to the customer representative talking them. 
“We have found BigQuery data to be immediately actionable. It focuses our marketing efforts, personalizes our onsite experiences, and improves the effectiveness of our sales department. When used in conjunction with our current data systems, there is seemingly no question about our customers that cannot be answered. It’s that powerful.”Andrew Duffle, Director FP&A, Analytics & Optimization, APMEX, Inc.
As a result of the work mentioned above, APMEX has decreased the average cost per acquisition (CPA) by more than 20% while maintaining the same level of new customer orders. 

They have also used Google Analytics Premium data to build a statistical model to target valuable customers earlier in their life cycle. For customers identified in the model, the company has increased email open rates by 58%, email conversion rates by 62%, and revenue per email by 163% as compared to the overall business. 

To read more about how APMEX and E-Nor used Google Analytics Premium along with BigQuery in order to make more informed decisions, download the full case study.


Posted by Daniel Waisberg, Analytics Advocate.

Thursday 28 May 2015

As complexity increases in the app ecosystem, successful developers are looking for new ways to measure, manage, and optimize across multiple ad networks and operating systems.  This morning, at our annual I/O conference, we announced via Livestream a new set of media partnerships and ads offerings designed to meet the unique needs of mobile app marketers.  

Transparent, open and reliable measurement solutions

For app developers looking to drive installs and engagement, it’s critical to understand the effectiveness of various media partners and placements. That’s why we have been investing in solutions to help developers apply consistent measures across a fragmented ecosystem of ad networks, and understand the quality of users that each delivers.  

Google Analytics for Apps provides an industry-leading solution for in-app analytics that is increasingly benefiting advertisers as they seek more transparency into ad effectiveness across networks.  You can already use Google Analytics to track the performance of your mobile app install campaigns and understand the lifetime value of your users on both Android and iOS. As of today, we’ve built partnerships with 20+ ad networks including InMobi and Millennial Media since launching iOS conversion tracking late last year. Data integration with these partners provides a comprehensive view of app value across networks based on the metrics developers care about (i.e., LTV and retention), helping you make better decisions on where to spend your advertising dollars. In the next few months, you’ll be able to “postback” your conversions to referring networks in order to optimize your traffic -- all made possible with a single SDK. 

And it's not just about our measurement solutions.  We recognize that developers should have choices when it comes to attribution vendors, and are committed to open solutions for the industry.  That’s why we also announced the ability to integrate app install and event data from key third party measurement partners into AdWords. Working with third parties, including Adjust, Appsflyer, Apsalar, Kochava, and Tune, we are able to increase measurement accuracy between different trackers in AdWords, ensuring your data is accurate and  reliable.

By partnering with these leading ad platforms and tracking systems, we believe we can make the entire mobile apps ecosystem stronger and more connected -- all with the goal of making developers more successful.

But we didn’t stop there. 

It’s easier than ever to promote your apps across Google 

For developers looking to promote their app, we offer a variety of placements across Google Search, the AdMob network, mobile sites, and YouTube.  And earlier this year, we announced Search Ads on Google Play. By showing ads alongside app search results, you can reach consumers right when they’re looking for a new app, at the moment they are ready to install
Click for full-sized image

Today we announced Universal App Campaigns, a new campaign type that allows advertisers to reach consumers across Google media more efficiently and effectively.  Universal App Campaigns offers a simple way to set up install ads for your Android apps in AdWords or directly from the Google Play Developer Console

Click for full-sized image

With a single campaign, you can scale your reach across Google Search, the AdMob network, mobile sites, YouTube and Google Play. Just provide us with a few inputs about your app what your ad creative will say, the audience you wish to reach, and how much you want to spend we’ll do the rest for you. Behind the scenes, our ad creation and bidding engines will help maximize performance for your campaigns so you can spend more time building and enhancing your apps.  Search Ads on Google Play and Universal App Campaigns will be rolled out to developers and advertisers in the coming months.

Complete solutions for your entire business

Today at I/O we also announced solutions to help you develop apps, engage users organically, and earn more money from your app.  Our innovations in analytics and ads are designed to complement these offerings, and allow you to grow your business with measurement solutions that are open and reliable, and promotion tools that make ad buying easier and more effective.  Thank you to all the developers out there who are building these experiences. We look forward to engaging with your apps and supporting your ongoing innovation by working closely with you and your partners in the ecosystem.

Posted by: Jonathan Alferness, Vice President, Product Management

Monday 18 May 2015


"Google Analytics has helped us increase the effectiveness of our AdWords remarketing campaigns by improving the targeting of our audiences and allowing us to present more relevant ads." 
Mike Telem, VP of Product Marketing at Marketo 

Marketo, a leading marketing automation company, is a strategic partner for thousands of companies. To take their own marketing to the next level, Marketo needed an analytics platform that was flexible enough to combine external data with user site behavior. They wanted to seamlessly leverage that data to improve the relevance of their marketing.

Marketo used a two-step approach for their marketing: first they used Marketo's Real-Time Personalization (RTP) product to identify characteristics—such as product interest and industry type—of Marketo's website visitors. Then they passed this data to Google Analytics in the form of events. This allowed Marketo to see Google Analytics visitor demographics and behavior information next to Marketo's RTP-identified characteristics for a more holistic picture of their user base in Google Analytics.

Using Google Analytics as the single source for customer data, Marketo segmented audiences in Analytics based on conversion stage or business vertical. With native integrations between Google Analytics and AdWords, Marketo was able to pass these specialized remarketing lists to AdWords and serve more personalized remarketing ads to its users in just a few, easy clicks.

These tailored ads had a huge impact and Marketo saw a jump in both engagement and conversions. Across the board, remarketing with Google Analytics drove a 10X higher conversion rate compared to traditional display marketing campaigns. Marketo also saw 200% more conversions in its B2C segment and an increase of 150% in conversions for its enterprise visitors.

To read the full case study, click here

Posted by: Kelley Sternhagen, Google Analytics Marketing 

Wednesday 13 May 2015

On March 25th, the Google Analytics Premium team hosted the first Google Analytics Hackathon in London. 18 developers from several agencies worked on the Google offices for a full day session of ‘hacking’. They connected devices like motion sensors, cameras, Raspberry Pi mini computers and even helicopters to send data to Universal Analytics using the Measurement Protocol - using “simple” technology to simulate real world applications.

The goal of the event was to help agencies innovate and think out of the box about how to use the Google Analytics Measurement Protocol with to collect valuable data from other sources than just websites and apps. Each group received a hackathon kit’, consisting of Raspberry Pis, motion detectors, cameras, Google Glass, smart watches, barcode scanners, credit card readers, Smart Things home automation sets, beacons, some basic python scripts, documentation and one Android controlled helicopter.


The teams were free to build what they wanted and came up with great solutions. Here are the most innovative ideas:
  1. A helicopter enthusiast racetrack: Hobby pilots swipe their member cards to log to the system and fly a remote controlled helicopter along a racetrack - Google Analytics successfully measures lap times and stores them with the pilot customer ID.
  2. The burglar alarm: Detects a burglary using real time events in Google Analytics with a motion detector and a camera.
  3. Healthy cat: Decides how much you feed your cat at night based on how many times the cat entered and left the house as measured by Google Analytics.

Here are some of the feedback we received from developers.

“It was an inspirational session and we already started experimenting with measurement protocol more and come up with some innovative ideas tailored to our clients” - BadriNarayanan Srinivasan, iProspect UK

“Something to highlight about the event was the chance to work with new and interesting technologies (bar code and card scanners, Android watches, Google Glass) and to integrate these with Google Analytics. Learning about new applications to help integrate GA/the use of the Measurement Protocol with Android and iOS apps was also awesome” - Jeff Lukey, Periscopix

“The day was brilliant and organised very well. It was great to be given such a wide range of technologies to try and use” - David Nwosu, DBi


Tuesday 12 May 2015

The following is a guest post from Supermetrics, a Google Analytics Technology Partner.

Google Analytics has some great tools to help you keep track of how well your ad campaigns bring new users to your website, including Goals, Multi-Channel Funnels, and Enhanced Ecommerce. But acquisition or conversion data alone don’t give you the full picture of ad performance. To understand how well your campaigns are doing, you need to contextualize conversion rates with cost data. 

Set up automatic cost data uploads 
AdWords linking lets you see your AdWords data imported to your Google Analytics account, though getting data from other sources can take longer and be a more manual process. You can make the process easier and go faster with a tool like Supermetrics Uploader add-on

Built using the Google Analytics Data Import feature, Supermetrics Uploader lets you set up automatic daily uploads from your Facebook Ads and Bing Ads with just a few clicks. You can also use Supermetrics Uploader to to import historical advertising data going back several years, and use it to manually upload CSV formatted data from any source. If your ad destination URLs are tagged with utm parameters, the imported cost data will be mapped to Google Analytics session data, and you’ll immediately see your return on ad spend (ROAS) and revenue per click (RPC) metrics for each campaign.

Watch this one-minute video to get an overview of Supermetrics Uploader.


See all of your cost data in your reports
Supermetrics Uploader can help get you a clear picture of how all your campaign spend compares with the results without having to switch between different reporting systems.

Within twenty-four hours after scheduling your first upload with Supermetrics Uploader, your data will start appearing in your Google Analytics Cost Analysis report, and in any of your Custom Reports that include ad cost, impressions, or clicks. All of your imported data will also be available in any 3rd party tools that connect to the to Google Analytics Reporting API.


- The Google Analytics Developer Relations team

Thursday 30 April 2015

The following is a cross post from Adometry by Google, a Marketing Analytics and Attribution product

Mass media drives people to interact with brands in compelling ways. When a TV or radio ad creates an I-want-to-know, I-want-to-go, or an I-want-to-buy moment in the mind of a consumer, many pursue it online. Immediately - and on whatever screen they have handy.

Last year, we announced Adometry TV Attribution, which measures the digital impact of offline channels such as television and radio. Now, we’re moving TV Attribution forward by integrating Google Search query data and Rentrak airings data to help marketers better understand the important moments their broadcast investments create.

New Search Behavior, New Search Analysis
Broadcast media doesn’t just drive consumers directly to websites — it drives searches. Now, TV attribution lets you analyze minute-by-minute aggregated Google Search query data against spot-related keywords to detect and attribute search “micro-conversions” to specific TV airings. 

With insights on the entire digital customer journey — including search behaviors — brands can better evaluate broadcast network and daypart, specific ad creative, and keyword performance. As a result, brands can:
  • Assess Immediate Influence: See which messages are sticking in the minds of consumers to both maximize TV interest and choose ideal keywords for SEO and paid search strategies.
  • Evaluate Awareness Goals: Optimize against a digital signal even when a site visit isn’t the primary goal, such as in brand awareness or sponsorship campaigns.
  • Analyze Competitive Category: Glean which generic keywords drive category interest for the industry — a type of insights not possible through site traffic analysis alone. 

Rentrak Partnership Speeds TV Attribution Insights
Knowing when your spots aired and collecting that data for timely TV attribution analysis can be a challenge. Marketers who buy broadcast media through agencies often don’t have direct access to this data. And once data is obtained — after coordinating with multiple agencies, partners, and TV measurement companies — the time lag makes for outdated analysis. 

TV Attribution now solves these challenges a new partnership with Rentrak, the leading and trusted source for TV airings information. 

What Rentrak Integration Delivers
Integrating directly with Rentrak TV Essentials, TV Attribution now overcomes some of the biggest hurdles in TV measurement, with increases in: 
  • Actionability: TV Attribution can more quickly and easily obtain TV data for analysis without time-consuming coordination from you or your agencies.  
  • Accuracy: Rentrak provides a comprehensive data set with aggregated viewership information from more than 30 million televisions across the country, and from more than 230 networks.
  • Frequency: A direct relationship means more frequent reporting since there is no longer a manual find-and-transfer of data required from TV buying partners.
“What makes this partnership so exciting is it removes the biggest barrier to truly measuring TV effectiveness, timely access to spot airings data including impressions,” said Tony Pecora, CMO for SelectQuote. “Rather than hunting and gathering data, we are now able to spend our time evaluating insights and optimizing our marketing investments across both TV and digital. As a CMO, this is a really big win for our business.”

Want to Get Moving?

The gap between offline and digital measurement continues to close. Learn more about how Adometry TV Attribution, now with Google Search query data and integrated Rentrak airings data, can help you gain more actionable cross-channel insights.

Posted by Dave Barney, Product Manager

Tuesday 28 April 2015

The following is a guest post from SkyGlue, a Google Analytics Technology Partner

SkyGlue is a powerful add-on tool for Google Analytics that helps web analysts to get more out of Google Analytics. With SkyGlue, you can automate Event Tracking for your website, zoom in on visitor analytics, and export and integrate your Google Analytics data with your own database or CRM. 
Automatic Event Tracking: Custom data collection without IT help
Your website probably offers many ways for visitors to interact with your content, so you need to know what your visitors do on your site, and not just which pages they visit. Although you collect important data about interactions like clicks, downloads, and modal popups using Google Analytics Event Tracking, it requires a fair amount of additional setup. And if you don’t have the IT resources to set up Event Tracking, it means that you’re missing out on collecting this important data. 
SkyGlue helps you gain independence from IT resources by automating Event Tracking with on-the-fly customization using SkyGlue web portal. By adding one line of JavaScript to your website, the SkyGlue app can track interactions with any HTML element on your website and then send this data to your Google Analytics account.  
SkyGlue Event Tracking visual overlay
Visitor analytics + Data export
SkyGlue supports multiple approaches to visitor tracking and offers special reports that let you see the entire sequence of visits and interactions. Integrated fully with Google Analytics advanced segments, these reports let you zoom-in on selected groups of visitors, helping you understand your customers’ behavior, discover patterns, identify technical glitches, improve customer service, and find ways to increase conversion and retention rates. You can also use SkyGlue to export your Google Analytics data on a daily basis, and integrate it with your own CRM and other data sources.
abc_appliances_updated.jpg
SkyGlue Individual Visitor Report (not based on real data)
SkyGlue puts some of Google Analytics most powerful features in the hands of every analyst. Use it to automate Event Tracking, get access to visitor analytics reports, and export and integrate Google Analytics data with other data sources. 
SkyGlue is free to try and takes only a few minutes to set up - check it out and see customer reviews in the Google Analytics Partner Gallery
For more information, visit the SkyGlue website and read real-world examples of how SkyGlue has already helped many business and organizations get more out of Google Analytics.  
- The Google Analytics Developer Relations team

Tuesday 14 April 2015

The Digital Analytics Association (DAA) San Francisco Chapter is hosting an evening of networking and conversation on the topic of ‘Optimizing Your Analytics Career’. 

We’d like to invite you to join us for an evening of networking and to hear from a great panel of seasoned experts and analytics newbies on their career paths, goals, and what the future holds. Come with your questions in mind and ask our experts everything you’ve wanted to know and discuss about excelling in the analytics industry.

Moderator: Krista Seiden, Analytics Advocate, Google

Panelists:
By attending you will:
  • Network with industry leaders and enjoy great casual conversations with your fellow analytics peers
  • Hear from our seasoned experts about their career paths, interests, educational opportunities, and skillsets needed in the analytics industry
Theme: Optimizing Your Analytics Career
When: Thursday April 23rd, 6:00pm - 8:00pm (career panel starting around 6:40pm)
Where: Roe Restaurant, 651 Howard St, San Francisco, CA 94105
Cost: The cost to attend the event is free for DAA members, $15 for non-members and $5 for students (students use this promo code: SFstudent). Students can join the DAA for $39 and also get admission to our annual symposium for free.

This will be an excellent opportunity to connect with your fellow analytics professionals and learn more about advancing in your profession. Join us!

Event website and registration: register here.

This event is organized by local DAA members and volunteers. We encourage you to become a member of the DAA and join our local efforts. Become a member and reach out to one of the local chapter leaders, Krista, Charles or Feras.

Posted by Krista Seiden, Analytics Advocate

Wednesday 8 April 2015

The following is a guest post by Leta Soza. Leta is the PR Engineer at AirPR where she lives and breathes PR strategy, content marketing, community cultivation, and analytics. Her analytics adoration stems from the firmly rooted belief that you can’t manage what you can’t measure, so bring on the data. She works with everyone from Fortune 500 companies to innovative startups in order to assist them in proving the ROI of their PR efforts while optimizing their strategies. 

It’s no secret that PR has historically been difficult to measure… quantitatively that is.

PR pros have always had to rely on less than stellar metrics (AVEs, impressions calculations, etc.) to show ROI, and with seemingly no viable reporting alternatives, PR has basically been relegated to the budgetary back seat.

For years, the industry has struggled to prove its value, lagging behind in technological innovation. But as every aspect of business becomes driven by data, vanity metrics are becoming unacceptable and PR is being held accountable for demonstrating its impact on the bottom line.

At AirPR, we’ve made it our mission to provide analytics, insights, and measurement solutions for the rapidly evolving PR industry. Our Analyst product focuses on increasing overall PR performance while seeking to solve systemic industry challenges through the application of big data.

Analyst, our measurement and insights solution, was created to assist PR and communication professionals in understanding what’s moving the needle in terms of their business objectives. 

Interested in how many potential customers came to your website from that press hit? Curious which authors drove the most social amplification during a specific quarter? Want to more deeply understand message pull-through or even attribute revenue? Analyst simplifies getting these answers.

One of the key features of Analyst is our unique integration with Google Analytics. Our integration arms Analyst users with a comprehensive snapshot of the PR activities driving business objectives, as well as the insights to understand the media placements (earned or owned) that are achieving specific company aims, giving PR professionals a single dashboard dedicated to displaying the performance of their efforts. Completing the GA integration creates a comprehensive view of the most meaningful and actionable PR data in aggregate which then allows users to click into any piece of data for more context. 
AirPR Analyst Dashboard (click for full-sized image)

In PR attribution is key, so we leverage Google Analytics data in order to display PR-specific performance and demonstrate ROI. Our aim: To change the way the industry thinks about PR analytics, insights, and measurement and to provide the solutions that support this shift. 

To quote legendary management consultant Peter Drucker, “In this new era of ‘big data’ it is even more important to convert raw data to true information.” Our goal is to deliver actionable and meaningful information. When decision makers understand what’s working, they can increase effort on certain aspects, eliminate others, and make impactful budget allocation decisions for future PR campaigns, much like they do for advertising.

To learn more about AirPR Analyst, check us out in the Google Analytics app gallery.

Posted by Leta Soza, PR Engineer at AirPR 

Tuesday 31 March 2015

Ever feel like you just can’t keep up with all the new features in Google Analytics? We hear you! To help you keep track of everything that’s going on, we’ve started publishing Release Notes in our product Help Center.

Release notes will be updated periodically and will have the most comprehensive list of new features or changes to the Google Analytics product. So, if you see something new in your account and have questions, we recommend starting here. We’ll point you to the relevant documentation to get you up to speed on everything you need to know.

We're happy to be adding another resources to keep our users informed. Check it out today!

Posted by Louis Gray, Analytics Advocate

Thursday 26 March 2015

Marketers, developers, and practitioners of analytics depend on having the right data at the right time - but implementing analytics code or AdWords pixels can be a less than fun (or easy) experience. Google Tag Manager makes tagging simple and fast by letting you add tags with a simple UI instead of code, while also offering advanced tracking features used by some of the web’s top sites.

Today we’re excited to announce the launch of the Solutions Guide section on the Google Analytics and Google Tag Manager Help Centers. The Solutions Guide area is focused on providing actionable, hands on, step-by-step instructions for implementing Google Analytics, AdWords, DoubleClick, and other third party tags via Google Tag Manager. 

In this guide, you’ll learn:
  • When and why to use Google Tag Manager
  • Best practices for naming conventions and setup tips
  • When to choose the Data Layer or the Tag Manager UI
  • How to implement GA event tracking, custom dimensions & cross-domain tracking
  • How to setup AdWords, Doubleclick, and Dynamic Remarketing tags in GTM
We’re thrilled to share this with you and hope you find it helpful as you implement Google Tag Manager.

Check out the new GTM Solutions Guide today!

Happy Tagging.

Posted by Krista Seiden, Analytics Advocate

Wednesday 25 March 2015

Measurement is constantly evolving, and while metrics by themselves each tell us something interesting, they do not necessarily tell the whole story or equally important, what to do next. In essence, our tools provide the what, but not always the why. As marketers and analysts, we need to put in the work and be able to take the next steps with our data: tell the whole story to our teams and stakeholders and be consultative in decision making and direction.

This is really important to get right, because use of data for companies is still new territory for many (frequently, decisions are still just based on how marketers feel). And while this may have been fine in a pre-digital age, the future of your company may very well depend on embracing analytics. With fragmentation of users and channels, there’s just too much for anyone to do. So it comes down to knowing what really works and why - these are the modern modern keys to success.

In this recent talk, Googler Neil Hoyne, Global Program Manager Customer Analytics shares how to embrace the above as well as take the next steps with your measurement.

A few key takeaways:
  • You need to evolve your measurement plan to better fit the state of the web & complex customer journey (see our recent measurement guide to help).
  • Question if you have the right goals or you need to adjust, and don’t be afraid to change goals if need be. Really make sure you have the right macro & micro conversions.
  • Build an attribution model (also see our guide) that works for your brand, considering the unique factors that make up your business and what messages make sense in each different context (for example, mobile, social, email, etc). 
  • Measure your customers in a user-centric way, move beyond the old session-based world.
Watch the whole talk embedded below:
And be sure and connect with Neil on Twitter and Google+

Posted by the Google Analytics Team

Wednesday 18 March 2015

We all make mistakes, but the damage might seem irrevocable when accidentally deleting crucial reporting information from Google Analytics. Thanks to feedback from our users, we’re pleased to introduce a new feature to provide a safety net each time you delete a view, property or account from your Google Analytics account: the Trash Can.

To get started, navigate to the Administration tab, select an account, and click the Trash Can feature on the left-hand panel. Check off what you want to reclaim, click “Restore,” and voilà! Your view, property or account is now just as it was before you deleted it. Once 35 days pass from the day you originally trashed it, however, you’ll have to say a final goodbye as the data will be removed from the Trash Can and will no longer appear there. 


This feature will be rolling out to all Google Analytics accounts in the coming weeks, but don’t worry–anything you’ve deleted starting today will still show up in the Trash Can once you get the feature update in your account. 

Many people rely on Google Analytics to collect, analyze, and report on data in order to make good business decisions. We hope that the Trash Can is just one more way to ensure that you have all the information you need when you need it. To learn more details about the Trash Can feature, please read this Help Center article.

Posted by Chris Cahill, Michael Masukawa, and Dan Morenus

Tuesday 17 March 2015

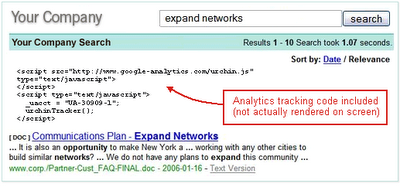
Google's enterprise team has just released an update to the Google Mini that features integration with Google Analytics. The Google Mini is a hardware and software solution that businesses use to search internal corporate data, as well as public websites. By adding integration with Google Analytics, the Mini just became an even better solution for searching public websites. By adding Analytics tracking code into the search results, the Mini's administrator can understand what visitors are searching for and whether searchers are able to find the information they need. Previously Mini owners had to manually customize their search results to include tracking code, and the new integration makes this process much easier.

To configure a Google Mini to use Google Analytics, an admin need only set the Google Analytics account number inside of the Mini's administrative interface. The output format of the search results will automatically include the JavaScript that Google Analytics uses to study a user's navigation across your website.


Learn more about the mini and Google's enterprise search solutions, and buy the mini at the Google Store.

Every now and then we will share updates from other Googlers about the products they're working on if we think that info will benefit Google Analytics users. Google Apps for Your Domain is similar to Google Analytics in that it offers simple and useful ways to view and share information online. And with these apps, you are actively creating information as well. Marlin Gilbert from the Google Apps team explains:
Like Google Analytics, Google Apps for Your Domain gives you the opportunity to focus your precious resources on campaigns and programs that rapidly grow your business. We built these tools to enable your team to communicate and collaborate more effectively without any additional hardware or software. Everything is online and accessible from any internet-connected device through a standard web browser. And you can customize the tools your company uses with your own special branding, color scheme and content.

Currently, you can take advantage of Gmail, Google Talk, Google Calendar and Google Page Creator and the new start page feature. For instance:
  • Using Gmail, without changing your email addresses, your employees can enjoy a faster and clearer way to read email conversations, and find saved messages with powerful search tools.
  • Coordinating complex schedules is a breeze with Google Calendar.
  • Keep your people in touch through Google Talk and use Google Page Creator to make your web page ideas come to life.
  • The start page is a central place for your employees to preview their inboxes and calendars, access your essential content, and search the web.
And we are working to make more apps available soon, so you can keep focusing on what you do best.

Google Apps for Your Domain is free, and currently in beta. Learn more and get started here.


Wednesday 11 March 2015

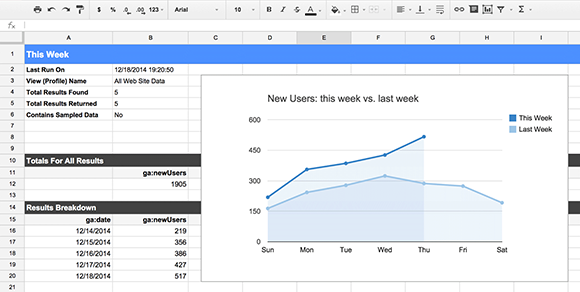
It's common for Google Analytics users to use spreadsheets to analyze their Google Analytics data or combine it with another data source. But exporting your data from Google Analytics to Google Sheets is a manual process, and it can be tedious if you run reports frequently or manage multiple accounts. With the release of Add-ons for Google Sheets, getting your Google Analytics data into Google Sheets has never been easier!

Add-ons allow you to extend the power of Google Sheets by automating common tasks and integrating with external services. The Google Analytics Spreadsheet Add-on allows you to access your Google Analytics data, right from within a spreadsheet!


The Google Analytics Spreadsheet Add-on
The Google Analytics Spreadsheet Add-on combines the power of the Google Analytics API with the rich feature set of Google Sheets, making it easier for Google Analytics users to access, visualize, share, and manage their data. With this add-on you can:
  • Query and report data from multiple views.
  • Compute and display custom calculations.
  • Create visualizations and embed those visualizations on third-party websites.
  • Schedule your reports to run and update automatically.
  • Control who can see your data and visualizations by using Google Sheets' sharing and privacy features.
But perhaps the best way to find out what the Google Analytics Spreadsheet Add-on can do is to see it in action. In this short video I introduce the add-on, show you how to install it, and walk you through creating your first report.


If you want to go deeper, you can watch this more advanced video where I explain in detail the process of building a complete dashboard that automatically updates and can be embedded on a third-party website.


If you have more questions about how to use the add-on, check out the documentation. It explains each of its features and configuration options in much more detail.

Supermetrics and Analytics Canvas add-ons
The Google Analytics Spreadsheet Add-on gives users a powerful yet user-friendly way to access their Google Analytics data, but it doesn't solve all business integration needs.

For more advanced business and data-integration solutions, I strongly recommend trying out these two excellent Google Sheets add-ons created by our technology partners:
Both of these add-ons integrate with Google Analytics as well as a variety of other platforms and services such as Facebook, Twitter, Microsoft Office, and many more. Free and premium versions are available. 

Feedback and Support
Add-ons are a great way to automate the process of getting your Google Analytics data into Google Sheets. We hope you take the time to try out these add-ons and see how they can improve your workflow.

If you use the Google Analytics Spreadsheet Add-on, we'd love to know what you think. You can leave a review in the Chrome Web Store, ask any questions you have in the add-on discussion group, or submit feedback directly from within Google Sheets.

Any and all feedback is welcome!

By: Philip Walton, Developer Programs Engineer, Google Analytics

Thursday 5 March 2015

Successful developers understand that in order to have a popular app, focusing on retaining a loyal user base is just as important as driving new installs. Today at the Game Developer Conference in San Francisco, we introduced new reports that will help you measure how to do this in two meaningful ways. We’re happy to announce that Mobile App Analytics will now let you understand how users come back to your app day after day, and provide the rich insights you need in order to measure their value over time. Let’s take a look at how these new reports can help make your app a hit.

Active Users
The active user report displays your 1-day, 7-day, 14-day and 30-day trailing active users next to each other in one, easy-to-view dashboard. The new overview gives immediate insights into how users interact with your app over time, along with dropoff rate comparisons. With this report, an app download is only the beginning of a potentially valuable relationship with your new users.

Benchmark active users at 1-7-14-30 days by selecting the segments you want. (Click to enlarge image)
While these metrics help you monitor your active user trends, when put into context they can answer important questions about your user acquisition strategies. For example, if you are investing in different campaigns, you can compare the cost of retaining users acquired via paid traffic versus organic to understand if you are attracting the right type of users. Not only can you measure your cost effectiveness, but you can also continue to monitor whether or not the users you paid for are still coming back after the campaign is over. This is particularly important when trying to keep your loyal user base engaged and happy with your app.

Lior Romano, Founder and CEO of Gentoo Labs (the makers of  Contacts+ for iOS and Android), was one of the first customers to try out this new report during our beta test period. He found the Active Users report especially useful when managing and organizing all their information at-a-glance: “We love the new Google Analytics Active Users feature -- it's a real time-saver! We get a quick overview of the 1/7/14/30-day active user trends side by side in a snap, which helps us to easily track our main metrics.”

Cohort Analysis
After learning how many users have opened your app, the next step in driving engagement is understanding when they come back. Cohort Analysis is a user analysis technique that allows you to analyze and compare your users by looking at their customer journey. Using Cohort Analysis, you can see when users are coming back to your app and their behavior over time after the day of the first session, and lets you further filter the information by day, week or month. We’ve also added the ability to compare different segments of users based on the day of the first install. 

In order to validate your user acquisition strategies, Cohort analysis lets you compare different periods or campaigns. For example, you can compare different weeks or months to measure the retention effectiveness of a single channel to see if you continue to attract valuable users throughout a campaign. The flexibility of the report also allows you to see how much time users are spending in an app as they come back day after day. With these valuable insights, Mobile App Analytics users can tailor their acquisition campaigns or app experience, just as our partner E-Nor did: “Cohort analysis in GA made it easy for E-Nor to gauge the effectiveness of lead nurturing efforts during an app free-trial promotion campaign. The analysis clearly showed that many users responded well to email and in-app reminders, resulting in over 50% retention between the 3rd and 5th day post sign-up as opposed to 30% in the first and 2nd day.

See at a glimpse when users are coming back to your app. (Click to enlarge image)

Lifetime Value
Analyzing retention is a great way to ensure users stick with your app and come back day after day. With Lifetime Value reporting, you’ll get a full picture of these users’ value over time. To get the most out of this report, it’s important to start with a clear definition of what a user’s value means to you based on your business objectives. Once you’ve defined the value, you can access the report to measure certain variables such as revenue per user and number of screen views per user over a period of 90 days. For example, if the goal of your app is to get users to purchase virtual or material goods, you’ll want to use this report to get a clear view of when they make a purchase and how much they are spending in your app over time.

Lifetime Value is a key metric to use to measure the effectiveness of your acquisition campaigns. If your cost to acquire a new user is higher than the average value over time, you might want to optimize your campaigns to meet the lifetime revenue they generate. Lifetime Value is particularly valuable if you offer in-app purchases, but it can be applied to discovering many other useful insights, such as number of times they open your app, total number of screens and goal completions.

Session duration per users compared to goal completion over a 60 day window. (Click to enlarge image)

How to get started
Cohort Analysis report can be found under the ‘Audience’ section in your Google Analytics account, and is now available in beta. Lifetime Value and Active Users reports are coming soon to all Analytics accounts.

To get started login into your Analytics account and look for the new reports under the Audience section. 


Posted by Gene Chan and Rahul Oak on behalf of the Google Analytics Team

Sunday 1 March 2015

We have put a tremendous amount of effort into making Google Analytics more intuitive and easy to use. The hard part is teaching people how to use their insights to drive action. We hope to change that with the introduction of our very own Google Analytics Playlist on YouTube. Here you can check out full-length presentations on advanced analytics implementation, best practices, how to create a data driven culture and more.

We have a solid lineup of videos to start with taken on August 1st when we held our first ever Google Conversion University event. It was attended by 100+ representatives from major companies across all major verticals. Attendees got the chance to share ideas, meet with our team, and listen to some great presentations on optimizing their web analytics experiences. You will find those presentations, filmed live in August, now on YouTube.

Those of you who want to pick up a few quick tips might be interested in 'Bounce Rate: The Simply Powerful Metric ', 'Non Ecommerce Sites: Beyond Averages...', and ' Context and Actionability in Web Analytics' by Avinash Kaushik, our resident Analytics Evangelist, blogger, and author of Web Analytics: An Hour a Day. We also have the complete sessions, including an introduction to Conversion University by Brett Crosby, Sr. Manager, which provides perspective on the evolution and direction of Google Analytics. Stephanie Hsu covers key reports for the optimal AdWords campaign. Alex Ortiz touches upon a number of advanced techniques such as segmentation through filters. And Tom Leung covered how to enhance your entire user experience using Website Optimizer.

In the future, you can expect more in-depth content about the Google Analytics product to be filmed and posted here in this Playlist. These videos are a great source of insight into how you can continually improve your web analytics practices, and even into our own team here at Google. We hope you enjoy them.


Thursday 26 February 2015

The following was originally posted on the Google Online Security Blog.

If you run a web site, you may already be familiar with Google Webmaster Tools and how it lets you know if Safe Browsing finds something problematic on your site. For example, we’ll notify you if your site is delivering malware, which is usually a sign that it’s been hacked. We’re extending our Safe Browsing protections to automatically display notifications to all Google Analytics users via familiar Google Analytics Notifications.


Google Safe Browsing has been protecting people across the Internet for over eight years and we're always looking for ways to extend that protection even further. Notifications like these help webmasters like you act quickly to respond to any issues. Fast response helps keep your site—and your visitors—safe.

Posted by: Stephan Somogyi, Product Manager, Security and Privacy

Wednesday 25 February 2015


"Discover where your site visitors come from, what pages they visit, how long they stay, what they buy, what makes them give up, and where they go"

Google Analytics, by Mary E. Tyler and Jerri L. Ledford (Wiley Publishing) has just come out, the first of what we hope will be many helpful titles on Google Analytics. It walks through the whys and hows of most of the Google Analytics reports and provides some good hypothetical and real-world cases of how you can use the information. If you have been trying to avoid using filters and regular expressions, you may find the chapter on "Filtering Your Data" to be particularly helpful. However, there have been some important developments since this book went to press: the book does not discuss the new AdWords Analysis and AdWords Keyword Positions reports and you no longer need an invitation to create a Google Analytics account.