As an analytics practitioner, one of the most important things I try to teach marketers is how to properly tag their campaigns so we can report on the success of their efforts. To do this, I've created a guide for them to follow to make it easy to choose the proper UTM codes to have consistent campaign tagging across the business. This allows us to begin to assign source and medium values to finance channels and usage metrics to really understand how each campaign performs in terms of our bottom line business metrics.
OVERVIEW
Setting up tracking and reporting on your marketing campaigns is simple and fun. This guide will walk you through the process and demonstrate with a real-life example.
Part A: Set up UTM tracking code
1. Below are all the elements you’ll need. If you set these up correctly, you’ll be able to report on multiple elements of your campaign:
- Campaign -name of your overarching campaign - e.g. spring-2013-collection or summer-2013-announcements. Be sure to follow a consistent campaign naming structure.
- Medium - the medium used to send your campaign. Include “email” for an email campaign, “cpc” for ads, “social” for a social network or “landing-page” if you’re tracking button clicks from a landing page.
- Source - used to differentiate the type of medium. If medium = cpc, then source may be google, bing, or yahoo. If utm medium = email, source can be used to call out the action (try, buy, coupon, awareness, etc).
- Content - this is essentially a bonus field - it can be used to track many differentiating factors for your campaign. For example, you can use this field to track different versions of your email or landing page - e.g. “60-dollars-off” or “15-percent-off”.
2. Make a copy of this
template and update it with your campaign’s values. You’ll likely end up with several tracking links for your campaign.
3. Tag each version of your campaign creative with the matching link. After updating the values, your tracking link should something like this:
https://www.googlestore.com/?utm_source=coupon&utm_medium=email&utm_campaign=summer-sale&utm_content=15-percent-off
Part B: Testing reporting
1. Before launching your campaign, verify that your tags are working correctly. Open an incognito window and click on one of the links you set up to track your campaign. If your campaign’s objective is trial signup, try completing the trial sign up form. If your objective is redeeming a coupon, try redeeming the coupon. Try this with each tag created for your campaign (best practice is to clear your cookies in the incognito window before clicking each tag). For landing pages - make sure to go all the way through to your main site or objective.
- Recommended best practice is to try each link multiple times, dropping off at various points to ensure you can track a funnel flow.
2. Wait 24 hours (in a crunch data should populate in analytics within 4-6 hours but depends on volume).
4. After signing into analytics you will be on the “Audience Overview” page. Click on “Traffic sources” - > “sources” - > “campaigns”.
5. Type the name of your campaign into the search box in the middle of the page and click on the search icon.

You should now see an overview of all clicks on your campaign. However, since you are in a non-standard report in GA sampling will likely occur (you may not see all - or even any of the test clicks on your campaign). Given sampling, you may need to export an unsampled report after all filters/segments are applied to your test - see step 9.
Click into this overview.

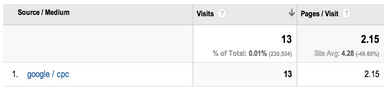
7. A screen similar to the below should appear, breaking out your campaign performance into different source/medium.
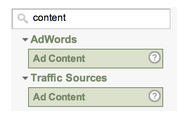
8. To drill down into the different elements of your campaign, click on the “secondary dimension” tab and type in the element - this could be “content” (shown below) or “medium” or “source”.
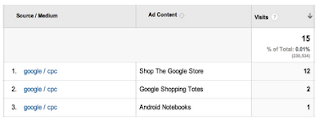
You will then see your Source/Medium broken down by content. In this example utm_content was used for ad creative, so the Ad Content secondary dimension breaks each Source/Medium down by which creative was clicked.
9. If all of your test campaign metrics are coming up in GA reporting you are ready to launch (be sure to keep track of # of links clicked/steps completed for each test link to match back data). Good luck! And come back to GA to see reports on your live campaign.
Part C: Advanced Reporting
A few more notes on nifty things you can do with GA reporting.
1. Advanced segments enable you to view all data in GA for a target segment in your campaign.
- Click on “Advanced Segments” at the top of your GA window.

- Click the button “+new custom segment”
- Using “and” or “or” statements, define the segment of your campaign you want to see GA data for:

- Save the segment. You can now browse through your Analytics reports, viewing data only for this segment
2. Set up a
dashboard. Under “MY STUFF” on the left-hand navigation. Click “Dashboards”. Here you can customize a dashboard for external stakeholders looking to monitor the performance of your campaign.
Happy tagging and analyzing!
Posted by Krista Seiden, Product Marketing Manager, Google Enterprise