Tuesday 31 March 2015

Ever feel like you just can’t keep up with all the new features in Google Analytics? We hear you! To help you keep track of everything that’s going on, we’ve started publishing Release Notes in our product Help Center.

Release notes will be updated periodically and will have the most comprehensive list of new features or changes to the Google Analytics product. So, if you see something new in your account and have questions, we recommend starting here. We’ll point you to the relevant documentation to get you up to speed on everything you need to know.

We're happy to be adding another resources to keep our users informed. Check it out today!

Posted by Louis Gray, Analytics Advocate

Thursday 26 March 2015

Marketers, developers, and practitioners of analytics depend on having the right data at the right time - but implementing analytics code or AdWords pixels can be a less than fun (or easy) experience. Google Tag Manager makes tagging simple and fast by letting you add tags with a simple UI instead of code, while also offering advanced tracking features used by some of the web’s top sites.

Today we’re excited to announce the launch of the Solutions Guide section on the Google Analytics and Google Tag Manager Help Centers. The Solutions Guide area is focused on providing actionable, hands on, step-by-step instructions for implementing Google Analytics, AdWords, DoubleClick, and other third party tags via Google Tag Manager. 

In this guide, you’ll learn:
  • When and why to use Google Tag Manager
  • Best practices for naming conventions and setup tips
  • When to choose the Data Layer or the Tag Manager UI
  • How to implement GA event tracking, custom dimensions & cross-domain tracking
  • How to setup AdWords, Doubleclick, and Dynamic Remarketing tags in GTM
We’re thrilled to share this with you and hope you find it helpful as you implement Google Tag Manager.

Check out the new GTM Solutions Guide today!

Happy Tagging.

Posted by Krista Seiden, Analytics Advocate

Wednesday 25 March 2015

Measurement is constantly evolving, and while metrics by themselves each tell us something interesting, they do not necessarily tell the whole story or equally important, what to do next. In essence, our tools provide the what, but not always the why. As marketers and analysts, we need to put in the work and be able to take the next steps with our data: tell the whole story to our teams and stakeholders and be consultative in decision making and direction.

This is really important to get right, because use of data for companies is still new territory for many (frequently, decisions are still just based on how marketers feel). And while this may have been fine in a pre-digital age, the future of your company may very well depend on embracing analytics. With fragmentation of users and channels, there’s just too much for anyone to do. So it comes down to knowing what really works and why - these are the modern modern keys to success.

In this recent talk, Googler Neil Hoyne, Global Program Manager Customer Analytics shares how to embrace the above as well as take the next steps with your measurement.

A few key takeaways:
  • You need to evolve your measurement plan to better fit the state of the web & complex customer journey (see our recent measurement guide to help).
  • Question if you have the right goals or you need to adjust, and don’t be afraid to change goals if need be. Really make sure you have the right macro & micro conversions.
  • Build an attribution model (also see our guide) that works for your brand, considering the unique factors that make up your business and what messages make sense in each different context (for example, mobile, social, email, etc). 
  • Measure your customers in a user-centric way, move beyond the old session-based world.
Watch the whole talk embedded below:
And be sure and connect with Neil on Twitter and Google+

Posted by the Google Analytics Team

Wednesday 18 March 2015

We all make mistakes, but the damage might seem irrevocable when accidentally deleting crucial reporting information from Google Analytics. Thanks to feedback from our users, we’re pleased to introduce a new feature to provide a safety net each time you delete a view, property or account from your Google Analytics account: the Trash Can.

To get started, navigate to the Administration tab, select an account, and click the Trash Can feature on the left-hand panel. Check off what you want to reclaim, click “Restore,” and voilĂ ! Your view, property or account is now just as it was before you deleted it. Once 35 days pass from the day you originally trashed it, however, you’ll have to say a final goodbye as the data will be removed from the Trash Can and will no longer appear there. 


This feature will be rolling out to all Google Analytics accounts in the coming weeks, but don’t worry–anything you’ve deleted starting today will still show up in the Trash Can once you get the feature update in your account. 

Many people rely on Google Analytics to collect, analyze, and report on data in order to make good business decisions. We hope that the Trash Can is just one more way to ensure that you have all the information you need when you need it. To learn more details about the Trash Can feature, please read this Help Center article.

Posted by Chris Cahill, Michael Masukawa, and Dan Morenus

Tuesday 17 March 2015

Google's enterprise team has just released an update to the Google Mini that features integration with Google Analytics. The Google Mini is a hardware and software solution that businesses use to search internal corporate data, as well as public websites. By adding integration with Google Analytics, the Mini just became an even better solution for searching public websites. By adding Analytics tracking code into the search results, the Mini's administrator can understand what visitors are searching for and whether searchers are able to find the information they need. Previously Mini owners had to manually customize their search results to include tracking code, and the new integration makes this process much easier.

To configure a Google Mini to use Google Analytics, an admin need only set the Google Analytics account number inside of the Mini's administrative interface. The output format of the search results will automatically include the JavaScript that Google Analytics uses to study a user's navigation across your website.


Learn more about the mini and Google's enterprise search solutions, and buy the mini at the Google Store.

Every now and then we will share updates from other Googlers about the products they're working on if we think that info will benefit Google Analytics users. Google Apps for Your Domain is similar to Google Analytics in that it offers simple and useful ways to view and share information online. And with these apps, you are actively creating information as well. Marlin Gilbert from the Google Apps team explains:
Like Google Analytics, Google Apps for Your Domain gives you the opportunity to focus your precious resources on campaigns and programs that rapidly grow your business. We built these tools to enable your team to communicate and collaborate more effectively without any additional hardware or software. Everything is online and accessible from any internet-connected device through a standard web browser. And you can customize the tools your company uses with your own special branding, color scheme and content.

Currently, you can take advantage of Gmail, Google Talk, Google Calendar and Google Page Creator and the new start page feature. For instance:
  • Using Gmail, without changing your email addresses, your employees can enjoy a faster and clearer way to read email conversations, and find saved messages with powerful search tools.
  • Coordinating complex schedules is a breeze with Google Calendar.
  • Keep your people in touch through Google Talk and use Google Page Creator to make your web page ideas come to life.
  • The start page is a central place for your employees to preview their inboxes and calendars, access your essential content, and search the web.
And we are working to make more apps available soon, so you can keep focusing on what you do best.

Google Apps for Your Domain is free, and currently in beta. Learn more and get started here.


Wednesday 11 March 2015

It's common for Google Analytics users to use spreadsheets to analyze their Google Analytics data or combine it with another data source. But exporting your data from Google Analytics to Google Sheets is a manual process, and it can be tedious if you run reports frequently or manage multiple accounts. With the release of Add-ons for Google Sheets, getting your Google Analytics data into Google Sheets has never been easier!

Add-ons allow you to extend the power of Google Sheets by automating common tasks and integrating with external services. The 
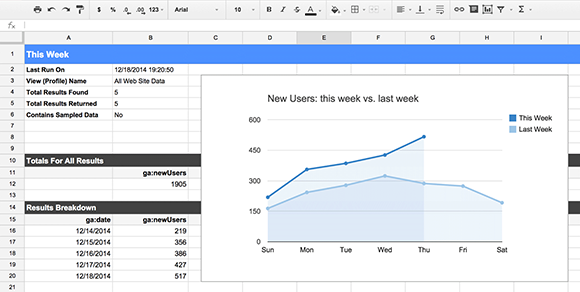
Google Analytics Spreadsheet Add-on allows you to access your Google Analytics data, right from within a spreadsheet!


The Google Analytics Spreadsheet Add-on
The Google Analytics Spreadsheet Add-on combines the power of the Google Analytics API with the rich feature set of Google Sheets, making it easier for Google Analytics users to access, visualize, share, and manage their data. With this add-on you can:
  • Query and report data from multiple views.
  • Compute and display custom calculations.
  • Create visualizations and embed those visualizations on third-party websites.
  • Schedule your reports to run and update automatically.
  • Control who can see your data and visualizations by using Google Sheets' sharing and privacy features.
But perhaps the best way to find out what the Google Analytics Spreadsheet Add-on can do is to see it in action. In this short video I introduce the add-on, show you how to install it, and walk you through creating your first report.


If you want to go deeper, you can watch this more advanced video where I explain in detail the process of building a complete dashboard that automatically updates and can be embedded on a third-party website.


If you have more questions about how to use the add-on, check out the documentation. It explains each of its features and configuration options in much more detail.

Supermetrics and Analytics Canvas add-ons
The Google Analytics Spreadsheet Add-on gives users a powerful yet user-friendly way to access their Google Analytics data, but it doesn't solve all business integration needs.

For more advanced business and data-integration solutions, I strongly recommend trying out these two excellent Google Sheets add-ons created by our technology partners:
Both of these add-ons integrate with Google Analytics as well as a variety of other platforms and services such as Facebook, Twitter, Microsoft Office, and many more. Free and premium versions are available. 

Feedback and Support
Add-ons are a great way to automate the process of getting your Google Analytics data into Google Sheets. We hope you take the time to try out these add-ons and see how they can improve your workflow.

If you use the Google Analytics Spreadsheet Add-on, we'd love to know what you think. You can leave a review in the Chrome Web Store, ask any questions you have in the add-on discussion group, or submit feedback directly from within Google Sheets.

Any and all feedback is welcome!

By: Philip Walton, Developer Programs Engineer, Google Analytics

Thursday 5 March 2015

Successful developers understand that in order to have a popular app, focusing on retaining a loyal user base is just as important as driving new installs. Today at the Game Developer Conference in San Francisco, we introduced new reports that will help you measure how to do this in two meaningful ways. We’re happy to announce that Mobile App Analytics will now let you understand how users come back to your app day after day, and provide the rich insights you need in order to measure their value over time. Let’s take a look at how these new reports can help make your app a hit.

Active Users
The active user report displays your 1-day, 7-day, 14-day and 30-day trailing active users next to each other in one, easy-to-view dashboard. The new overview gives immediate insights into how users interact with your app over time, along with dropoff rate comparisons. With this report, an app download is only the beginning of a potentially valuable relationship with your new users.

Benchmark active users at 1-7-14-30 days by selecting the segments you want. (Click to enlarge image)
While these metrics help you monitor your active user trends, when put into context they can answer important questions about your user acquisition strategies. For example, if you are investing in different campaigns, you can compare the cost of retaining users acquired via paid traffic versus organic to understand if you are attracting the right type of users. Not only can you measure your cost effectiveness, but you can also continue to monitor whether or not the users you paid for are still coming back after the campaign is over. This is particularly important when trying to keep your loyal user base engaged and happy with your app.

Lior Romano, Founder and CEO of Gentoo Labs (the makers of  Contacts+ for iOS and Android), was one of the first customers to try out this new report during our beta test period. He found the Active Users report especially useful when managing and organizing all their information at-a-glance: “We love the new Google Analytics Active Users feature -- it's a real time-saver! We get a quick overview of the 1/7/14/30-day active user trends side by side in a snap, which helps us to easily track our main metrics.”

Cohort Analysis
After learning how many users have opened your app, the next step in driving engagement is understanding when they come back. Cohort Analysis is a user analysis technique that allows you to analyze and compare your users by looking at their customer journey. Using Cohort Analysis, you can see when users are coming back to your app and their behavior over time after the day of the first session, and lets you further filter the information by day, week or month. We’ve also added the ability to compare different segments of users based on the day of the first install. 

In order to validate your user acquisition strategies, Cohort analysis lets you compare different periods or campaigns. For example, you can compare different weeks or months to measure the retention effectiveness of a single channel to see if you continue to attract valuable users throughout a campaign. The flexibility of the report also allows you to see how much time users are spending in an app as they come back day after day. With these valuable insights, Mobile App Analytics users can tailor their acquisition campaigns or app experience, just as our partner E-Nor did: “Cohort analysis in GA made it easy for E-Nor to gauge the effectiveness of lead nurturing efforts during an app free-trial promotion campaign. The analysis clearly showed that many users responded well to email and in-app reminders, resulting in over 50% retention between the 3rd and 5th day post sign-up as opposed to 30% in the first and 2nd day.

See at a glimpse when users are coming back to your app. (Click to enlarge image)

Lifetime Value
Analyzing retention is a great way to ensure users stick with your app and come back day after day. With Lifetime Value reporting, you’ll get a full picture of these users’ value over time. To get the most out of this report, it’s important to start with a clear definition of what a user’s value means to you based on your business objectives. Once you’ve defined the value, you can access the report to measure certain variables such as revenue per user and number of screen views per user over a period of 90 days. For example, if the goal of your app is to get users to purchase virtual or material goods, you’ll want to use this report to get a clear view of when they make a purchase and how much they are spending in your app over time.

Lifetime Value is a key metric to use to measure the effectiveness of your acquisition campaigns. If your cost to acquire a new user is higher than the average value over time, you might want to optimize your campaigns to meet the lifetime revenue they generate. Lifetime Value is particularly valuable if you offer in-app purchases, but it can be applied to discovering many other useful insights, such as number of times they open your app, total number of screens and goal completions.

Session duration per users compared to goal completion over a 60 day window. (Click to enlarge image)

How to get started
Cohort Analysis report can be found under the ‘Audience’ section in your Google Analytics account, and is now available in beta. Lifetime Value and Active Users reports are coming soon to all Analytics accounts.

To get started login into your Analytics account and look for the new reports under the Audience section. 


Posted by Gene Chan and Rahul Oak on behalf of the Google Analytics Team

Sunday 1 March 2015

We have put a tremendous amount of effort into making Google Analytics more intuitive and easy to use. The hard part is teaching people how to use their insights to drive action. We hope to change that with the introduction of our very own Google Analytics Playlist on YouTube. Here you can check out full-length presentations on advanced analytics implementation, best practices, how to create a data driven culture and more.

We have a solid lineup of videos to start with taken on August 1st when we held our first ever Google Conversion University event. It was attended by 100+ representatives from major companies across all major verticals. Attendees got the chance to share ideas, meet with our team, and listen to some great presentations on optimizing their web analytics experiences. You will find those presentations, filmed live in August, now on YouTube.

Those of you who want to pick up a few quick tips might be interested in 'Bounce Rate: The Simply Powerful Metric ', 'Non Ecommerce Sites: Beyond Averages...', and ' Context and Actionability in Web Analytics' by Avinash Kaushik, our resident Analytics Evangelist, blogger, and author of Web Analytics: An Hour a Day. We also have the complete sessions, including an introduction to Conversion University by Brett Crosby, Sr. Manager, which provides perspective on the evolution and direction of Google Analytics. Stephanie Hsu covers key reports for the optimal AdWords campaign. Alex Ortiz touches upon a number of advanced techniques such as segmentation through filters. And Tom Leung covered how to enhance your entire user experience using Website Optimizer.

In the future, you can expect more in-depth content about the Google Analytics product to be filmed and posted here in this Playlist. These videos are a great source of insight into how you can continually improve your web analytics practices, and even into our own team here at Google. We hope you enjoy them.