In between rolling out new features for Google Analytics, we also like to feature how users and companies are actually using our products. Matt Stannard of 4PS Marketing details how to easily monitor Twitter and see number of tweets, active users, and hashtags for a topic using Universal Analytics. We’ve excerpted parts of his post below, read on to see the results, and don’t forget to click through to see the technical details!
How?
Step 1 - Create a new account
First, we need to create a new account, which is accomplished easily through the new look and feel of Analytics. Remember this is under Admin and then in the Account drop down. I made a new Universal Analytics account for my particular experiment - you then need to note the UA number.
Step 2 - Install PHP / MySQL
I downloaded a WAMP stack called XAMPP as I wanted to use PHP as my Twitter monitoring library. XAMPP includes Apache, PHP and MySQL. You can use any tool of your choose provided you are able to edit the code and add the necessary Measurement Protocol requests. The library I used is was from 140Dev.
Step 3 - Create Twitter Application
In order to use the PHP monitoring library you need to have a Twitter Application. You can create this by signing in at https://dev.twitter.com/. Click My Applications:

Create your application and after you've done this you will need to note the Consumer Key, Consumer Secret, Access Token, Access Token Secret.

Step 4 - Start Monitoring
So, now we've got our Twitter application we can begin monitoring, in the 140dev package you need to modify a few files, firstly the db_config.php. You can find the code here, on the original blog post.
Results
The reporting interface of Google Analytics is actually very effective at monitoring Twitter as you are able to look in Real Time, use Dashboards, or custom reports.
The Real Time Analytics is fantastic at showing how active the things your are monitoring on Twitter is. If you just look at the Real Time overview as this screenshot shows:
 |
| (click image for full-sized version) |
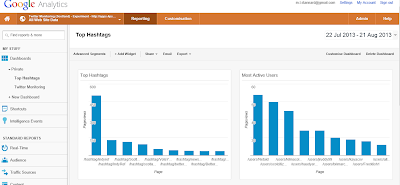
You can use Dashboards to report on key areas of interest and apply whatever filtering you need, the dashboard below just shows the key hashtags, users, users mentioned and urls shared:
 |
| (click image for full-sized version) |
Custom Reporting also allows us to produce charts such as what times of the day users were active:
 |
| (click image for full-sized version) |
The full post can be found here.
Posted by Aditi Rajaram, Google Analytics Team


