Thursday, 31 October 2013

Here's some great news from Google’s search team: In-app content is now becoming visible in Google search. Starting today, users on Android devices can jump straight from Google search results to pages inside an app.

For Google Analytics for mobile apps users, this opens up a new world of insights into areas like revenues, engagement and overall app usage.

We've reposted the original blog post below. And if you haven't already, try Google Analytics for mobile apps for powerful insights into how users engage with your app.

There are many reasons to build or not to build a mobile app as part of your broader mobile strategy. For instance, while apps offer a rich user experience, users can’t access them through Google Search like they do websites. Today, we’re announcing a new Google Search capability, app indexing, that will start to make apps more accessible through Google on Android.
Let’s say that a user is searching for a movie. With app indexing, Google will begin to include deep links to apps in Android search results. When the user taps on the “Open in app” deep links, the app opens up directly to the movie in question.
In this example, in order for the app deep links to appear in search results,
  • The Flixster app supports deep linking
  • The Rotten Tomatoes website has specified that the Flixster app page is an alternate for the web page
  • Google has indexed the Flixster app to determine relevance
  • The user has installed the Flixster app
The end result is that users will have a seamless search experience when accessing your app content through Google.
Google is currently testing app indexing with an initial group of developers including AllTheCooks, AllTrails, Beautylish, Etsy,Expedia, Flixster, Healthtap, IMDb, moviefone, newegg, OpenTable, Trulia, and Wikipedia. Deep links for these applications will start to appear in Google search results on Android, in the US, in a few weeks.

How to get started

If you are interested in enabling indexing for your Android app, you can learn more about our developer guidelines at developers.google.com/app-indexing and sign up. We are expanding our app indexing efforts and will gradually include more developers over time.
Posted by Chaesang Jung, Software Engineer

Wednesday, 30 October 2013

In between rolling out new features for Google Analytics, we also like to feature how users and companies are actually using our products. Matt Stannard of 4PS Marketing details how to easily monitor Twitter and see number of tweets, active users, and hashtags for a topic using Universal Analytics. We’ve excerpted parts of his post below, read on to see the results, and don’t forget to click through to see the technical details!

How?

Step 1 - Create a new account
First, we need to create a new account, which is accomplished easily through the new look and feel of Analytics. Remember this is under Admin and then in the Account drop down. I made a new Universal Analytics account for my particular experiment - you then need to note the UA number.

Step 2 - Install PHP / MySQL
I downloaded a WAMP stack called XAMPP as I wanted to use PHP as my Twitter monitoring library. XAMPP includes Apache, PHP and MySQL. You can use any tool of your choose provided you are able to edit the code and add the necessary Measurement Protocol requests. The library I used is was from 140Dev.

Step 3 - Create Twitter Application
In order to use the PHP monitoring library you need to have a Twitter Application. You can create this by signing in at https://dev.twitter.com/. Click My Applications:


Create your application and after you've done this you will need to note the Consumer Key, Consumer Secret, Access Token, Access Token Secret. 


Step 4 - Start Monitoring
So, now we've got our Twitter application we can begin monitoring, in the 140dev package you need to modify a few files, firstly the db_config.php. You can find the code here, on the original blog post.

Results
The reporting interface of Google Analytics is actually very effective at monitoring Twitter as you are able to look in Real Time, use Dashboards, or custom reports.

The Real Time Analytics is fantastic at showing how active the things your are monitoring on Twitter is. If you just look at the Real Time overview as this screenshot shows:

(click image for full-sized version)

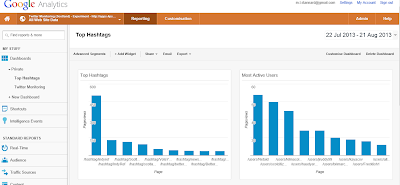
You can use Dashboards to report on key areas of interest and apply whatever filtering you need, the dashboard below just shows the key hashtags, users, users mentioned and urls shared: 

(click image for full-sized version)
Custom Reporting also allows us to produce charts such as what times of the day users were active:

(click image for full-sized version)

The full post can be found here.

Posted by Aditi Rajaram, Google Analytics Team

Monday, 28 October 2013

Google AdSense is a free, simple way for website publishers to earn money by displaying targeted Google ads on their websites. Today, we’ve added the ability to access AdSense data from the Google Analytics Core Reporting API. The AdSense and Analytics integration allows publishers to gain richer data and insights, leading to better optimized ad space and a higher return on investment.

In the past, accessing AdSense data using the Analytics Core Reporting API has been a top feature request. We’ve now added 8 new AdSense metrics to the Analytics Core Reporting API, enabling publishers to streamline their analysis.

Answering Business Questions
You can now answer the following business questions using these API queries:

Which pages on your site contribute most to your AdSense revenue?

dimensions=ga:pagePath
&metrics=ga:adsenseCTR,ga:adsenseRevenue,ga:adsenseECPM &sort=-ga:adsenseRevenue

Which pages generate a high number of pageviews but aren't monetizing as well as other pages?

dimensions=ga:pagePath
&metrics=ga:pageviews,ga:adsenseCTR
&sort=-ga:pageviews

Which traffic sources contribute to your revenue?
dimensions=ga:sourceMedium
&metrics=ga:adsenseCTR,ga:adsenseRevenue,ga:adsenseECPM
&sort=-ga:adsenseRevenue

Reporting Automation
By accessing this data through the API, you can now automate reporting and spend more time doing analysis. You can also use the API to integrate data from multiple sites into a single dashboard, build corporate dashboards to share across the team, and use the API to integrate data into CRM tools that display AdSense Ads.

Getting Started
To learn more about the new AdSense data, take a look at our Google Analytics Dimensions and Metrics Explorer. You can also test the API with your data by building queries in the Google Analytics Query Explorer.

Busy? In that case, now’s a great time to try these Analytics API productivity tools:
  • Magic Script: A Google Spreadsheets script to automate importing Analytics data into Spreadsheets, allowing for easy data manipulation. No coding required!
  • Google Analytics superProxy: An App Engine application that reduces all the complexity of authorization.

We hope this new data will be useful, and we're looking forward to seeing what new reports developers build.

Posted by Nick Mihailovksi, Product Manager, Google Analytics API Team

Wednesday, 23 October 2013

Last year we launched Universal Analytics, a new technology that allows you to measure customer interactions across platforms and devices. As we announced at the 2013 Google Analytics Summit, we’ve been working on a solution to help you upgrade your existing properties to the new infrastructure without losing any historical data.

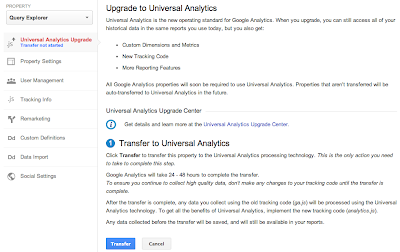
Today, we’re announcing the Universal Analytics Upgrade Center, an easy, two-step process to upgrade your existing properties from classic Google Analytics to Universal Analytics.

Once you complete the upgrade process, you can continue to access all of your historical data, plus get all the benefits of Universal Analytics including custom dimensions and metrics, a simplified version of the tracking code, and better cross-domain and cross-device tracking support.

Getting Started

You can upgrade your classic Google Analytics properties into Universal Analytics properties by following these two steps:

Step 1: Transfer your property from Classic to Universal Analytics.
We’ve developed a new tool to transfer your properties to Universal Analytics that we will be slowly enabling in the admin section of all accounts. In the coming weeks, look for it in your property settings.


Step 2: Re-tag with a version of the Universal Analytics tracking code.
After completing Step 1, you’ll be able to upgrade your tracking code, too. Use the analytics.js JavaScript library on your websites, and Android or iOS SDK v2.x or higher for your mobile apps.

Universal Analytics Auto-Transfer

Our goal is to enable Universal Analytics for all Google Analytics properties. Soon all Google Analytics updates and new features will be built on top of the Universal Analytics infrastructure. To make sure all properties upgrade, Classic Analytics properties that don’t initiate a transfer will be auto-transferred to Universal Analytics in the coming months.

Upgrade Resources

To answer common questions, we’ve put together the Universal Analytics Upgrade Center, a comprehensive guide to the entire upgrade plan. This guide includes an overview of the process, technical references for developers, and a project timeline with phases of the overall upgrade.

We’ve also included FAQs in the Upgrade Center, but if you need more information, you can also visit the new Universal Analytics Google Group to search for answers and ask more specific questions.

We’re excited to offer you this opportunity to upgrade, and hope you take advantage of the resources we’ve created to guide you through the process. Visit the Universal Analytics Upgrade Google Group to share your comments and feedback. We’d love to hear what you have to say!

Posted By Nick Mihailovski, on behalf of the Google Analytics Team

Thursday, 17 October 2013

The following is a guest post contributed by Dan Wilkerson, marketing manager at LunaMetrics, a Google Analytics Certified Partner & Digital Marketing Consultancy.

A core issue with measuring social media is that due to the way that traffic migrates around the web, there are lots of situations where we lose referrer information and those visits end up being labeled as 'Direct' inside of our analytics.

This can happen for a variety of reasons, but the most common situations where this kind of erroneous attribution occurs are:
  • When a user clicks an untagged link inside an email
  • When a user visits from a mobile application
  • When a user clicks a link shared to them via an instant message
If a visitor has come to your site previously, Google Analytics will simply apply the same referral information it had for their previous visit, which it retrieves from the UTMZ cookie it previously saved on the visitor's browser. But, if there are no cookies, Analytics has no information, and buckets the visitor into Direct.

Obviously, this is problematic; 'Direct' is supposed to represent visitors who bookmark or directly type in our URL. These users are accessing our site through a shared link, and should be counted as referrals. Thankfully, we have some tools at our disposal to combat some of these scenarios, most notably campaign parameters. But campaign parameters only help with links that you share; what about when a visitor comes to your site and shares the link themselves?

These visits can cause serious problems when it comes time to analyze your data. For example, we offer Google Analytics & AdWords training. Most of our attendees are sponsored by their employers. This means they visit our site, scope out our training, and then email a link to a procurement officer, who clicks through and makes the purchase. Since the procurement officer comes through on the emailed link and has never visited our site, the conversion gets bucketed into 'Direct / None' and we lose all of the visit data for the employee who was interested in the first place. This can compound into a sort of feedback loop - the only data we see would be for individuals who buy their own tickets, meaning we might optimize our marketing for smaller businesses that send us less attendees. In other words, we'd be interpreting data from the wrong customers. Imagine how this kind of feedback loop might impact a B2B trying to generate enterprise-level leads - since they'd only see information on the small fry, they could wind up driving more of the wrong kind of lead to their sales team, and less of the right kind.


For a long time, this has been sort of the status quo. Now, with new features available in Universal Analytics, we have some tools we can employ to combat this problem. In this post, I want to share with you a solution that I've developed to reduce the amount of Direct traffic. We're calling it DirectMonster, and we're really excited to make it open source and available to the Google Analytics community.

What is DirectMonster?
DirectMonster is a JavaScript plug-in for Google Analytics that appends a visitor's referral information as ciphered campaign parameters as an anchor of the current URL. The result looks something like this:


When the visitor copies and shares the URL from the toolbar, they copy that stored referral information along with it. When someone without referral information lands on the site through a link with those encoded parameters, the script decodes that information as campaign parameters to pass along to Google Analytics, waits until Analytics writes a fresh UTMZ cookie, and then ciphers, encodes, and re-appends the visitors current referral information. It also appends '-slb' to the utm_content parameter. That way, those visits can be segmented from 'canonical' referrals for later analysis, if necessary. The visitor who would have had no referral information now is credited as being referred from the same source as the visitor who shared the link with them. This means that visits that normally would have been erroneously segmented as 'Direct / None' will now more accurately reflect the channel that deserves credit for the visit. 

At first, this might seem wrong - shouldn't we just let Analytics do its job and not interfere? But, the fact is that those visits aren't really Direct, at least not in its truest interpretation, and having 'assisted referrer' channel information gives you actionable insight. Plus, by weeding out those non-Direct scenarios, your Direct / None numbers will start to more accurately represent visitors who come to your site directly, which can be very important for other measurement and attribution. It's actually better all the way around. After all, if a Facebook share is what ultimately drove that visitor to your site, isn't having that information more valuable than having nothing at all? This way, you'll have last-click attribution for conversions that otherwise would have simply been bucketed as Direct. Of course, you won't have the visit history of the assisting referrer, but... well, more on that soon.

We've been fine-tuning this on our site for the past few months, and we've been able to greatly enhance our conversion attribution accuracy. In our video case study, I mentioned that we enhanced attribution by 47.5%; since that time, we've seen the accuracy of our data continue to climb; whereas before, we were seeing 'Direct / None' account for 45.5% of our conversions, it now accounts for just 20.6% - a decrease of 54.7%. Better yet, look at what it's done to all of our traffic:


We've gone from having about 20-25% of our traffic come in 'Direct / None' to just under 15%, and I anticipate that number will continue to fall.

DirectMonster and Universal Analytics
One of the coolest features that Universal Analytics has given us is Custom Dimensions. If you're not familiar with them, take a minute and read the Google Developer Resources page about what they are and how they work. Although initially designed for the asynchronous code, Universal Analytics has allowed us to put DirectMonster on steriods. 

In our Universal implementation, we store the visitors CID as a visit-level custom dimension, and we add their CID to the hashed parameters we're already storing in the anchor of their URL. 

When a visitor comes through on a link with a CID that differs from their own, we capture the stored CID as the Assisted Referrer. Then, we can open up our Custom Reports later on and view what visitors were referred to our site by whom, and what they did when they got there.

What does this mean? If a celebrity tweets a link to your product, you can discover exactly how many visitors they referred, and how much revenue those visitors generated. 

By cross-referencing the Assisted CID for single-visit 'Direct / None' purchases, you can discover the true visit history of a conversion.

Since it takes advantage of advanced Universal Analytics functionality, DirectMonster 2.0 requires some advanced implementation as well. Unlike its cousin, you'll need to adjust your Analytics tracking code to include a few functions, and you'll need to configure the Custom Dimensions you'll be storing a visitors CID and assisted referrers CID inside of. For a full reference on how to get either version of DirectMonster and configure it for your site, check out our blog post covering the topic in detail here or visit our GitHub page and get DirectMonster for yourself. 

I hope that you're as excited as I am about this development and all of the things Universal Analytics is enabling us to do. Think of a use case I didn't mention? Share it with me in the comments!

Posted by Dan Wilkerson, marketing manager at LunaMetrics

Wednesday, 16 October 2013

There are many ways to measure the effectiveness of organic search engine marketing. We’d like to explore various techniques in a series of posts here on the Analytics blog. Today we’ll talk about understanding organic using landing pages and Webmaster Tools data. 

Today, almost all marketers are investing heavily in creating high-quality content as a way to reach users with information about their products and services. The content can take many forms - from product specific content to brand specific content. The intent is to generate traffic and conversions from a variety of sources, one of the largest of which is often search.

One way to measure the effectiveness of content is to analyze its performance as a landing page. A landing page is the first page a user sees when they land on your site. If it’s great content, and if it’s ranked highly by search engines like Google, then you should see a lot of websites ‘entrances’ via that page. Looking at landing page performance, and the traffic that flows through specific landing pages, is a great way to analyze your search engine optimization efforts.

Begin by downloading this custom report (this link will take you to your Analytics account). This report shows the landing pages that receive traffic from Google organic search and how well the traffic performs. 

Let’s start at the top. The over-time graph shows the trend of Google organic traffic for your active date range. If you are creating great content that is linked to and shared then you should see the trend increasing over time.

When you look at this data ask yourself the question: how well does the trend align with my time investment? Looking at the data below we see that the organic traffic is increasing, so this organization must be working hard to create and share good content.

Organic traffic is steadily increasing for this site. An important question to ask is, “how does this align with my search optimization efforts?”
The table, under the trend data, contains detailed data about the acquisition of users, their behavior on the site and ultimately the conversions that they generate. This includes data like Visits, % New Visits, Bounce Rate, Average Time on Site, Goal Conversion Rate, Revenue and Per Visit Value. 

Using the tabular data I can learn how search engine traffic, entering through a specific page is performing. 

Each metric provides insight about users coming from organic search and entering through certain pages. For example, % New Visits can help you understand if you’re attracting a new audience or a lot of repeat users. Bounce rate can help you understand if your content is ‘sticky’ and interesting to users. And conversion rate helps you understand if organic traffic, flowing through these landing pages, is actually converting and driving value to your business.

Again, we’re using the landing page to understand the performance of our content in search engine results.

Remember, make sure that you customize the report to include goals that are specific to your account. You can learn more about goals and conversions in our help center.  

Another very useful organic analysis technique is to group your content together by ‘theme’ and analyze the performance. For example, if you are an ecommerce company you may want to group all of your pages for a certain product category together - like cameras, laptop computers or mobile phones.

You can use the Unified Segmentation tool to bundle content together. For example, here’s a simple segment that includes two branded pages (I’m categorizing the homepage and the blog page homepage as ‘brand’ pages).


You can create other segments that include other types of pages, like specific category pages (and then view both segments together). Here is the Acquisition > Keywords > Organic report with both segments applied. This helps me get a bit more insight into the types of pages people land on when visiting from Google organic search results.

Plotting two segments, one for branded content landing pages and one for non-branded landing pages, can help you understand your specific tactics.
Regardless of the tool you use, the analysis technique is the same: look at the performance of each landing page to identify if they are generating value for your business. And don’t forget, the best context for this data is your search engine marketing plan. 

Here’s one final tip when analyzing organic traffic. Whenever you create a customization in Google Analytics, like a segment or custom report, don’t use the keyword dimension. Instead use the Source and Medium dimensions. Set the Source to ‘Google’ and Medium of ‘Organic’. It provides the most consistent data over long time periods. 

In addition to using Google Analytics, you can also use the data from Webmaster Tools to gain an understanding of your search marketing tactics. You can link your Google Analytics account and your Webmaster Tools account to access some of this data directly in Google Analytics. If you’re not familiar with Webmaster Tools, check out their help center for an overview or this awesome video.


In general the Webmaster Tools data will help you understand how well your content is crawled, indexed and ranked by Google. This is extremely tactical data that can inform many search marketing decisions, like which content to create, how to structure your content and how to design your pages. The reports are in the Acquisition > Search Engine Optimization section. 

Let’s start by viewing some data using the Acquisition > Search Engine Optimization > Landing Pages report.

Webmaster Tools data is available directly in Google Analytics. You can view the data based on landing page or search query.
Let’s review a couple of metrics that are unique to Webmaster tools: Impressions, Average Position and Click Through Rate. Impressions is the number of times pages from your site appeared in search results. If you’re continuously optimizing the content on your site you should see your content move up in the search results and thus get more impressions.

Average position is the average top position for a given page. To calculate average position, Webmaster Tools take into account the top ranking URL from your site for a particular query. For example, if Alden’s query returns your site as the #1 and #2 result, and Gary’s query returns your site in positions #2 and #7, your average top position would be 1.5 [ (1 + 2) / 2 ].

Click Through Rate (CTR) is the percentage of impressions that resulted in a click and visit to your site. Again, you can see both the impressions and the CTR for every landing page on your site. 

If we’re optimizing content then hopefully we should see our average position increase, the impressions increase and ultimately an increase in click-throughs. A very easy way to observe this behavior is by applying a date comparison to the Acquisition > Search Engine Optimization > Landing Pages report.

Use the Search Engine Optimization > Landing Pages report to understand if your content is getting ranked higher and generating clicks.
What happens if impressions and average position are increasing but you’re not getting clicks? You’re getting ranked better, but what is listed in the results may not get a response from the user. 

There are lots of ways to optimize your content and change what is listed in the search results. You could adjust your page title or meta description to improve the data that is shown to the user and thus increase the relevancy of the result and your Click Through Rate. 

We’ll be back soon with another article on measuring and optimizing organic search traffic with Analytics.

Posted by Justin Cutroni, on behalf of the Google Analytics Education team

Tuesday, 15 October 2013

Our goal is for Google Analytics APIs to be as simple to use as possible - so we just released 2 new features that make it even easier to use our APIs.

Relative dates
All Core API and MCF Reporting API queries previously required a start and end date. In the past, apps that displayed recent data - like the last 14 days - would have to manually determine today’s date, determine when 14 days ago was, and format the dates so they could be used.

To make things easier, we’ve added support for relative dates! You can now specify NdaysAgo as a value of either the start or end date. So the date range of the last 14 days from yesterday can now be expressed as:

start-date=15daysAgo&end-date=yesterday

Using these values will automatically determine the date range based on today’s date, allowing apps to always display the data for last 14 days (or whatever time period you’d like!).

Sample size control
In certain cases, data may be sampled. To simplify setting and reporting the impact of sampling, we’ve added a couple new sampling related features.

First, we added a new query parameter to set the level of sampling. Developers can now specify whether reports should be faster or be more precise.

Second, we added 2 new fields to the API response:

  • sampleSize - The number of samples that were used for the sampled query.
  • sampleSpace - The total sampling space size. This indicates the total available sample space size from which the samples were selected.
     

With these 2 values you can calculate the percentage of visits that were used for the query.

For example, if the sampleSize = 201,000 and sampleSpace = 220,000 then the report is based on 91.36% of visits.


Together, these values allow developers to see exactly how much data was used to calculate the sample.

Getting Started
There are two easy ways to get started: you can read our reference guide on the new relative dates feature, or check out our docs on the new sample size control query parameter and
sample size API response data. As always, you can stay up to date using our change logs
.

Friday, 11 October 2013

The need to customize and fine-tune your marketing measurement solutions becomes a key discriminator in unlocking additional value which might have been missed when applying out-of-the-box views on your data. For this reason, the Multi-Channel Funnel Analysis within Google Analytics Attribution provides the ability to configure content based channel groupings, as well as customized attribution models. This allows you to better reflect how partial credit is assigned to the marketing efforts driving your conversions. Having the ability to develop these customized assets is great, and now you are able to easily share them with your organization, your customers, or your audience. Here is how sharing a custom channel grouping, or custom attribution model works: 

Step 1 - Build a Custom Attribution Model
Building a custom model is easy. Just go to the Model Comparison Tool report in the Attribution Section of Conversions. In the model picker you can select ‘Create new custom model’, which opens the dialog to specify rules which can better reflect the value of marketing serving your specific business model. As an example, we can develop a model to value impressions preceding a site visit higher within a 24 hour time window. We also set the relevant lookback window to 60 days, as we know our most valuable users have longer decision and decide cycles:

Click image for full-sized version
Ensure you opt-in the Impression Integration, enabling Google Display Network Impressions and Rich-Media interactions to be automatically added to your path data through the AdWords linking. Don’t forget to also check out the recorded webinar from Bill Kee, Product Management Lead for Attribution, providing more details on how to create a custom model.

Step 2 - Access the Model in Personal Tools & Assets Section
In the admin section you can now look at your personal tools & assets. The newly created model will show up in the ‘Attribution Models’ section. You can find custom channel groupings you created under Channel Groupings.


The table shows all assets available, and a drop-down allows you to ‘share’ these assets through a link.


Step 3 - Share the Link - Done!
From the drop-down Actions menu select ‘Share’, and a permanent link to the configuration of this object is generated. This link will point to the configuration of the shared asset, allowing anyone with a GA implementation and the link to make a copy of the asset config, and save it into their instance of GA. You maintain complete control over who you share your assets with. 


Include the link to your brand-new attribution model asset in an email, IM message, or even a Blog Post, such as this one.

Happy Customizing!

Posted by Stefan F. Schnabl, Product Manager, Google Analytics

Thursday, 10 October 2013

We’re excited to announce that Google Tag Manager has publicly launched Auto-Event Tracking, which lets you measure events happening on the page without writing HTML or Javascript. Those of you measuring events in Tag Manager today will already have minds racing with the possibilities - skip ahead to the screenshot. Everyone else, read on.


As sites become more dynamic and want to understand users’ site experiences in more detail, business owners need to know more: how long are visitors staying on a particular page? How are they interacting with interactive elements like image carousels? How many are clicking the Contact Me button? How many are clicking outbound links? Increasingly, site analytics are incomplete without answers to questions like these.

Unfortunately, until now, answering these questions required adding custom Javascript code to your website to tell Google Analytics when the event occurred. Google Tag Manager users also needed to modify the HTML of each page where they wanted to track an event. That means every time you want to track something new, or change the way you track something, you need to modify site code directly (or, in some cases, ask another colleague to do it for you.) And slower deployment of measurement campaigns directly impacts your ROI.

With Google Tag Manager’s launch of Auto-Event Tracking, we’re excited to announce a solution that provides the power of event tracking without needing to write code. By using the new Event Listener tag, you can tell Tag Manager when you want to listen for events, and then write detailed rules for what to do when an event happens. See an example of listening for form submits here:


Once you have your event listener set up, you can have tags fire based on form submits using a rule that looks for the event gtm.formSubmit. (Of course, Tag Manager supports more than form submits: it also includes clicks and timer events.) You can also make sure you’re getting the right form by using our Auto-Event Variable macros that let you narrow things down with attributes like the element ID and the form target.

The end result: you can deploy event tracking to your site and send event tracking data to Google Analytics without adding any code to your site. You can deploy measurement campaigns faster, and not writing custom code makes your solutions more robust.

Of course, it’s easiest to see the whole picture by walking through a full example. Check out the following resources for more:
We’re looking forward to getting your feedback - let us know what you think!

Posted by Lukas Bergstrom, Google Tag Manager PM

Wednesday, 9 October 2013

Earlier this year, we announced the Google Analytics Solution Gallery with a collection of custom reports, segments and dashboards selected by our team to help new users get started. Today we are excited to open the platform to the public and allow any of our millions of users across the globe to share their favorite insights via the revamped Google Analytics Solutions Gallery


In addition to opening the platform for public submissions, we have also worked to integrate the browse, import and share functionality directly into your account via “Share” and “Import” buttons. So whether you are using your favorite dashboard to get a quick view of your site performance or working to set up a new segment, sharing and importing via the Solutions Gallery is just a click away. 


The gallery currently enables you to browse, share and import Segments, Custom Reports, Dashboards and Bundles of up to 20 perma-linkable templates. More information on how to do so is available in our help center

In the future, we look forward to enabling the seamless sharing and importation of everything from filters to attribution models, to custom channel groupings so keep an eye out for developments in this space and let us know what you think are the most important things to share in the comments!

Posted by Joshua Knox, Google Analytics team
Traffic sources in Google Analytics contains some of the most popular reports in our product and are accessed daily by millions of users. That’s why we’ve been thinking about how to evolve these reports to better present your key metrics and give you a broader view of your business. 

We know how important these reports are to you, and so we’re pleased to announce the launch of the new Acquisition reports which provide a window on your users’ Acquisition-Behavior-Conversion (ABC) cycle: how you acquire users, their behavior on your site after acquisition, and their conversion patterns. We conducted robust testing with users and saw that this setup was better for several reasons, including providing a better flow for analysis, more customization and well organized metrics.

The new Acquisitions will replace the ‘Traffic’ Sources’ section on the left hand navigation.

New reporting in acquisitions
As part of the new acquisitions we are also introducing two new reports:
  • Acquisition Overview quick summary view of traffic acquisition
  • Channels Report detailed view on a per channel basis
A more intuitive Overview report
The new overview report in the acquisition section is designed to provide you with a end to end view of how your business is operating giving you insights into how you are acquiring users, how they behave and who converts. By default, the Overview report shows you relative performance broken down by acquisition channels (more on that below). Use this report to get a quick look at:
  • Which channels acquire the most users
  • Which channels acquire users who engage most with your site
  • Which channels acquire users who result in the most conversions
Introducing channels 
Channels allow you to view your traffic acquisition at a higher level of granularity, allowing you to group similar sources using rules into logical buckets we call channels. By default all users will be pre-setup with eight channels; you can choose to customize and add more at anytime.

Channels are now a first class entity in all of analytics and will be made available in custom reports and the API soon. They are also shared across users of the same profile.

Editing the Channels
You can edit the Channels to define new channels, remove existing channels, and change channel definitions. The default Channel Grouping uses system-generated definitions for each channel. For example:
  • System Defined Channel exactly matches Direct
  • System Defined Channel exactly matches Referral
The system definitions are proprietary, and reflect Analytics’ current view of what constitutes each channel. While you cannot edit any of the system definitions, you can configure new rules to define a channel. For example, you can change the definition of the Social channel:

from:
System Defined Channel exactly matches Social
to:
Source contains plus.google.com|twitter.com

The updated reports will be gradually rolling out to all users starting today. We look forward to providing a cleaner, more intuitive experience for you and better analysis of Acquisitions.

We're thrilled with the response from users so far. Here's what Caleb Whitmore, Founder & CEO of Analytics Pros (a Google Analytics Certified Partner) had to say:
"The new Acquisition, Behavior, Conversion approach sharpens the focus for digital analysts on what matters most: how potential customers are acquired, how they behave, what their experience consists of, and last but not least, the outcomes from those behaviors - conversions.  We will benefit from the streamlined architecture and the enhanced focus on data that matters afforded by this addition to Google Analytics."
Posted by Nikhil Roy, Google Analytics Team