Friday 31 May 2013

As users discover, download, and use your apps, understanding your customers and what they're doing is incredibly important and has a direct impact on monetization. Leveraging smart analytics and analyzing key metrics can drive future monetization and new app discovery efforts, empowering you to become a smarter and more effective app developer or marketer. In short, your ability to drive maximum value from your app only starts after the download. 


Sign up for our upcoming Webinar and join Google Analytics team members Andrew Wales and Adam Singer as they explore the key metrics to measure for the mobile app ecosystem, as well as learn about the benefits of using Google Analytics for mobile app measurement, such as:

A more powerful mobile SDK
We are providing a new mobile app analytics solution, solving the problem that there is currently no single repository to understand end-to-end value of mobile app users. This is supported by a more powerful mobile SDK (v2.0) that is easy to implement.

“One stop shop” for app measurement
Understanding app performance holistically through acquisition, engagement and outcome is critical to improve mobile app results, optimize user engagement and increase revenue generated. Our new reports show the entire lifecycle and in our Webinar, we’ll explore each section.

Improve ROI and engagement
App developers and brands can make better, more comprehensive data-driven decisions for mobile investments with better reports. For example, marketers can optimize their mobile programs to improve ROI and app developers can improve in-app engagement.

Webinar information:
Title: Metrics for the Mobile App Ecosystem
Date: Wednesday, 6/12/2013 @ 1:00pm EST / 10am PST
Level: 101 - Beginner
Duration: 1 hour
Sign up link: Register here.

Posted by the Google Analytics team

Wednesday 29 May 2013

As an analytics practitioner, one of the most important things I try to teach marketers is how to properly tag their campaigns so we can report on the success of their efforts. To do this, I've created a guide for them to follow to make it easy to choose the proper UTM codes to have consistent campaign tagging across the business. This allows us to begin to assign source and medium values to finance channels and usage metrics to really understand how each campaign performs in terms of our bottom line business metrics. 

OVERVIEW
Setting up tracking and reporting on your marketing campaigns is simple and fun. This guide will walk you through the process and demonstrate with a real-life example.

Part A: Set up UTM tracking code

1. Below are all the elements you’ll need. If you set these up correctly, you’ll be able to report on multiple elements of your campaign:
  • Campaign -name of your overarching campaign - e.g. spring-2013-collection or summer-2013-announcements. Be sure to follow a consistent campaign naming structure.
  • Medium - the medium used to send your campaign. Include “email” for an email campaign, “cpc” for ads, “social” for a social network or “landing-page” if you’re tracking button clicks from a landing page. 
  • Source - used to differentiate the type of medium. If medium = cpc, then source may be google, bing, or yahoo. If utm medium = email, source can be used to call out the action (try, buy, coupon, awareness, etc).
  • Content - this is essentially a bonus field - it can be used to track many differentiating factors for your campaign. For example, you can use this field to track different versions of your email or landing page - e.g. “60-dollars-off” or “15-percent-off”.
2. Make a copy of this template and update it with your campaign’s values.  You’ll likely end up with several tracking links for your campaign.

3. Tag each version of your campaign creative with the matching link. After updating the values, your tracking link should something like this:

https://www.googlestore.com/?utm_source=coupon&utm_medium=email&utm_campaign=summer-sale&utm_content=15-percent-off

Part B: Testing reporting

1. Before launching your campaign, verify that your tags are working correctly. Open an incognito window and click on one of the links you set up to track your campaign. If your campaign’s objective is trial signup, try completing the trial sign up form. If your objective is redeeming a coupon, try redeeming the coupon. Try this with each tag created for your campaign (best practice is to clear your cookies in the incognito window before clicking each tag). For landing pages - make sure to go all the way through to your main site or objective.
  • Recommended best practice is to try each link multiple times, dropping off at various points to ensure you can track a funnel flow. 
2. Wait 24 hours (in a crunch data should populate in analytics within 4-6 hours but depends on volume).

3.  Go to google.com/analytics and click Sign in.

4. After signing into analytics you will be on the “Audience Overview” page. Click on “Traffic sources” - > “sources” - > “campaigns”.

5. Type the name of your campaign into the search box in the middle of the page and click on the search icon.


You should now see an overview of all clicks on your campaign. However, since you are in a non-standard report in GA sampling will likely occur (you may not see all - or even any of the test clicks on your campaign). Given sampling,  you may need to export an unsampled report after all filters/segments are applied to your test - see step 9.

Click into this overview.


7. A screen similar to the below should appear, breaking out your campaign performance into different source/medium.


8. To drill down into the different elements of your campaign, click on the “secondary dimension” tab and type in the element - this could be “content” (shown below) or “medium” or “source”.


You will then see your Source/Medium broken down by content. In this example utm_content was used for ad creative, so the Ad Content secondary dimension breaks each Source/Medium down by which creative was clicked.


9. If all of your test campaign metrics are coming up in GA reporting you are ready to launch (be sure to keep track of # of links clicked/steps completed for each test link to match back data). Good luck! And come back to GA to see reports on your live campaign.

Part C: Advanced Reporting

A few more notes on nifty things you can do with GA reporting.
1. Advanced segments enable you to view all data in GA for a target segment in your campaign. 
  • Click on “Advanced Segments” at the top of your GA window.  
  • Click the button “+new custom segment”
  • Using “and” or “or” statements, define the segment of your campaign you want to see GA data for:
  • Save the segment. You can now browse through your Analytics reports, viewing data only for this segment 
2. Set up a dashboard. Under “MY STUFF” on the left-hand navigation. Click “Dashboards”. Here you can customize a dashboard for external stakeholders looking to monitor the performance of your campaign.

Happy tagging and analyzing!

Posted by Krista Seiden, Product Marketing Manager, Google Enterprise

Tuesday 28 May 2013

The following is a guest post by Benjamin Mangold, Search & Analytics Director at Loves Data, a Google Analytics Certified Partner.

The Google Analytics User Conference is back in Australia for 2013, hosted by Google Analytics Certified Partners. This year the conference will be held in both Sydney and Melbourne.

Join local and international Google Analytics experts in Sydney on 19 June and Melbourne on 21 June. Google’s own Analytics Advocate, Justin Cutroni is returning as keynote speaker to present his expert advice and insights into Universal Analytics, a great new Google Analytics feature for onsite measurement across desktops, smartphones and tablets, and even the physical aspects of offline campaigns such as loyalty cards and billboards!


After the sold-out success of the conference last year, Loves Data is keeping the momentum going with a great speaker line-up of Google Analytics experts from the US, Singapore and Australia, a special slot on YouTube Analytics and marketing and technical slots by experts from industry. View the conference program and check out the conference speakers.

Topics include:
  • Attribution modelling
  • Multi-screen measurement
  • Driving action with dashboards
  • Leveraging online and offline data
  • YouTube Analytics
Book your conference ticket today before it’s sold out.

For conference updates follow Loves Data on Google+.

Posted by Benjamin Mangold, Google Analytics Certified Partner

Thursday 23 May 2013

The digital journey has grown more complex, giving customers the option to move seamlessly across media and devices. This shift in technology can make it challenging to get a complete picture of customers’ interactions.  As a marketer, your success depends on gaining visibility into your customers’ preferences and behaviors.


Next Thursday, join Sara Jablon Moked, Product Marketing Manager for Google Analytics, for a detailed look at effective measurement for today's multi-device world. We will discuss strategies and best practices for measuring customer behavior, and we’ll look at how Google Analytics and other Google tools can help you measure and respond to the evolving customer journey.

The webinar will include live Q&A.

Date: Thursday, May 30, 2013
Time: 10am PST / 1pm EST/ 6PM GMT
Duration: 1 hr
Level: 100 / Beginner
Register: Register here

Wednesday 22 May 2013

Just as physical stores need to keep track of their sales and in-store visits, businesses with an online presence need to understand how visitors are interacting with their site. Google Analytics provides tools to help understand and evaluate these interactions. For example, if purchases are your key objective, Ecommerce tracking allows you to measure sales performance. Yet sales are just one possible goal—there are many other important interactions that may be valuable to your business, such as media plays, social connections, newsletter sign-ups, a minimum purchase value, or the amount of time spent on a screen. Using Goals, you can measure these types of engagement activities and track how these interactions help you to meet your larger business objectives.

Today, we’re announcing several updates to Goals in Google Analytics—including a new set-up flow, new templates, and new verification capabilities—to make it easier for you to measure customer behavior and evaluate your performance. These updates are now live in Google Analytics.*

How to get started with Goals
Goals are set at the profile level. To find a profile in your Google Analytics account, click the Admin tab, then navigate to the account, property, and profile you want. Click Goals, then Create a Goal. Follow the flow to set up and start measuring your Goals. For guidance as you set up Goals, visit our help center.


Introducing templates: An easier way to set up Goals
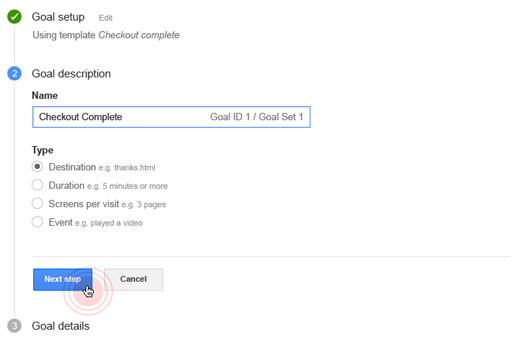
We’ve redesigned and added new 
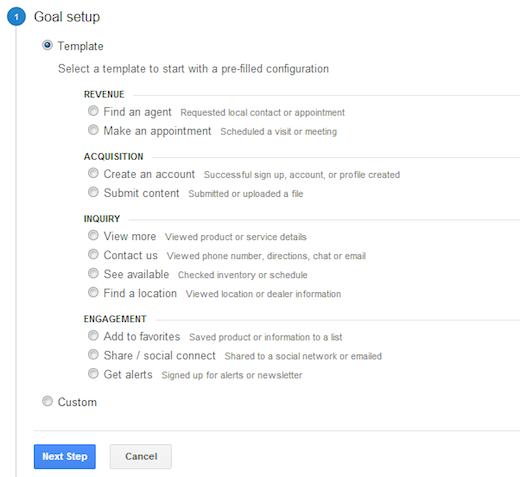
templates to the Goals set-up flow so you can add meaningful and actionable Goals to your Analytics account quickly.

When you use a template, the Goal setup flow is prefilled with suggested values (based on your industry) that you can either keep or change as you walk through the process. The templates are organized into four business objectives (Revenue, Acquisition, Inquiry, Engagement) to help you think about the purpose of each Goal, plus you can still create custom goals. Note that “revenue” goals don’t necessarily imply a direct sale -- these goals are user activities which have a strong impact on your desired business outcomes. Depending on your business model, a Revenue Goal could be a purchase, such as a completed checkout; or it could also be a successful lead submission, such as a scheduled appointment. Some Revenue Goals might lend themselves to Ecommerce tracking as well.


The templates you see are based on the Industry Category selected in your property settings, so you only see templates that are relevant to your business. We also added a set of 20 new industry categories to Google Analytics. This classification is now aligned with Google’s web standard for industry vertical classification. 
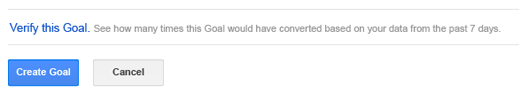
Please edit your property settings to make sure you’re using the one that best describes your business.

Verify each Goal before you save
In addition to the templates, we’ve added a way for you to check your setup before you save. You’ll find a verify option at the end of the setup flow that lets you see what the conversion rate would have been for the past seven days had this Goal been setup. Using the verify option gives you immediate feedback, so you can decide to save or modify the Goal configuration you’re working on.


Analyze how different Goals perform and relate to each other
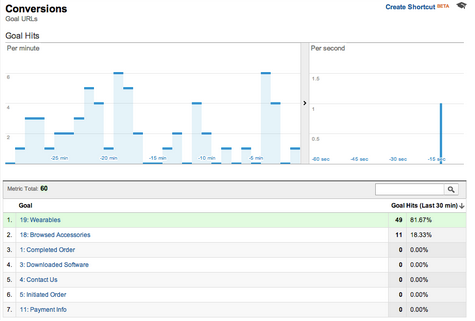
Use the 
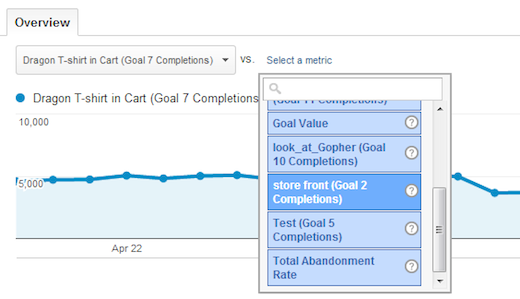
Goals Overview report under the Conversions section to see how your goal completions happen over time. Develop a sense how often a Goal conversion happens, and look to identify relationships between different Goals.

In the Goals Overview report you can use the metric selector to choose the relevant metric.


Example: Goal performance over time
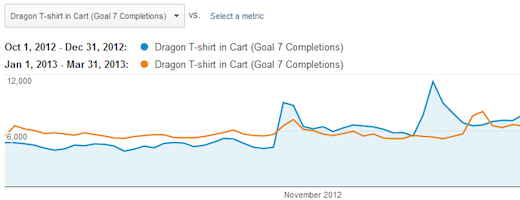
Select a single Goal and observe the performance over time. Use the date range selector and compare the Goal performance month on month, or quarter on quarter. This way you can compare seasonal trends, and the growth rate of your goal over time.


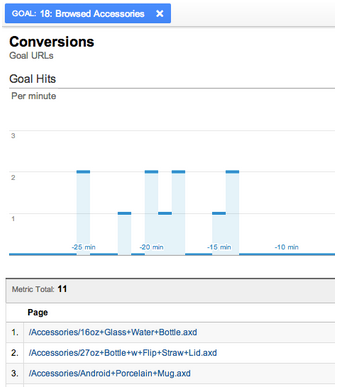
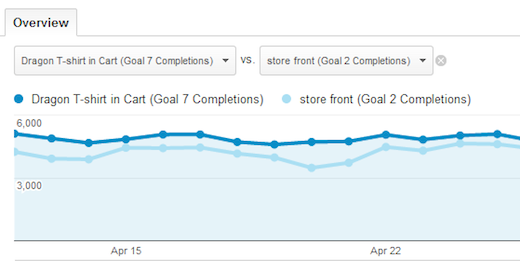
Example: Discover relationships between goals
Selecting two Goal completion metrics next to each other will allow you to see correlational effects over time. A Goal measuring site engagement, like a media interaction, or a social share, could be indicative of a rise in sales.

Ultimately, understanding how your users interact with your site allows you to make important decisions about site content and effective use of your marketing and advertising resources. In addition to the Goals overview report, you can look at the reports in Multi-Channel Funnels. These reports focus on your visitors’ entire path to conversion — including the different off-site interactions they had before making a purchase or completing a goal. See if you can discover new insights and additional opportunity through Goals.


Tuesday 21 May 2013

A version of the following post originally appeared on the DoubleClick Advertiser Blog.

On Tuesday, June 4th we’ll host our annual digital leadership summit, thinkDoubleClick, with provocative conversations about the future of digital marketing and media, and you’re invited to join via live stream by registering here!

Hear executives from advertising, agencies and publishers discuss some of the big questions in digital such as:
  • How do creatives leverage, but not be overwhelmed by, technology to deliver next-generation consumer experiences?
  • What unique experiences are publishers developing that add value to consumers and advertisers alike?
  • How do CMOs best use social with other marketing channels to build strong brands?  

The full agenda for the thinkDoubleClick event is listed below.  You can join in the conversation on June 4 by using the #thinkDCLK hash and commenting during the live stream at www.youtube.com/doubleclick.

Register here for the thinkDoubleClick summit

Event Date: June 4, 2013
Time: 9 am - 12:15 PDT

9:00 - 9:30 am
Connecting Digital, Accelerating Growth
9:30 - 10:00 am
The Coca-Cola Company's Liquid & Linked Marketing:
How a 127-year-old company is pivoting for success in a real-time, socially-connected world

The Coca-Cola Company sells over 500 brands in 207 countries, with over 700,000 System associates and 1.8B+ servings of their beverages everyday.  Hear insights and lessons learned on how the world's most valuable brand is remaining relevant by becoming more connected, transparent and nimble in real-time.

10:00 - 10:35 am
Advertisers Must be Inventors

This year, Volkswagen and Deutsch LA partnered with Google to work on a briefto re-imagine how to build a stronger, bigger community around its brand.  In today’s connected world, telling stories alone isn’t enough; we need to create tangible value and utility to bring the brand’s promise to life. In this session the creative team from Deutsch LA will be talking about the process for developing more rewarding and shareable experience.

10:35 - 11:15 am
Time to Rethink the Marketing Mix?
Emerging trends in digital marketing -- including new ad formats, the rise of social media, and proliferation of channels -- are creating new challenges and opportunities for brand marketers. What are the key trends marketers should be concerned about -- and how should they respond? AdAge deputy editor Michael Learmonth poses the hard questions in an executive dialogue on what’s next for
brand marketing.

Fireside chat with:
11:15 am -
12: 15 pm
New and Native: Extending the Conversation
Technology has had a profound impact on the media industry. This disruption, though, has brought along significant opportunities for creative publishers to thrive. In this session we’re bringing in three executives to show how they’ve leveraged the digital revolution to deliver more engaging content and differentiated solutions to advertisers.


We look forward to seeing you on June 4th at thinkDoubleClick.

Posted by the DoubleClick team

Monday 20 May 2013


It was a busy week in San Francisco at Google I/O. We unveiled new products and features, such as deeper mobile app analytics integration with Google Play and Google Tag Manager for mobile apps. If you missed the earlier announcement, you can learn about our new features here.


Our team at Google I/O!


We also gave several great presentations on some of our new features. Our Developer Relations team also showed off some tools for multi-screen measurement here, so take a look if you didn’t manage to catch our livestream this past Thursday.

We also presented on dynamically configuring mobile applications using Google Tag Manager for mobile apps, and talked about Google Analytics and AdSense data analysis in BigQuery.

It was great to see so many GA users and developers-- we can’t wait to see everyone next year at I/O!


Thursday 16 May 2013

The landscape in data analysis has changed rapidly in the past few years. Organizations and developers are analyzing larger data sets, from more data sources, to drive their decision-making. They are examining huge volumes of unsampled data to make informed business decisions--often mining information in business intelligence tools for strategic insights. For the data scientists that perform these analyses, having direct granular access to Google Analytics data is becoming increasingly important.

Today at I/O, we announced that we are giving Google Analytics Premium users the ability to glean new business insights by accessing session and hit level data and combining it with separate data sets. Organizations and developers can analyze in seconds without massive cost by leveraging Google BigQuery, a web service that lets developers and businesses conduct interactive analysis of big data sets and tap into powerful data analytics. 

Interactive data analysis and data ownership

The upcoming BigQuery integration, happening later this year, is a planned feature for Google Analytics Premium that allows clients to access their session and hit level data from Google Analytics within Google BigQuery for more granular and complex querying of unsampled data. For those unfamiliar with Google BigQuery, it’s a web service that lets you perform interactive analysis of massive data sets—up to trillions of rows. Scalable and easy to use, BigQuery lets developers and businesses tap into powerful data analytics on demand. Plus, your data is easily exportable; you own it.


Benefits of BigQuery
  1. Leverage Google’s massive computing power to get business insights from big data in seconds rather than hours.
  2. Analyze massive amounts of data in the cloud with no up-front investments (hardware provisioning or software licensing investments).
  3. Share and collaborate quickly and securely using Access Control Lists. 
  4. Store as much as you want, paying only for what you use.
  5. Protect your data with multiple layers of security from Google.
Potential Uses of the Google Analytics Premium and BigQuery Integration

Having Google Analytics session and hit level data available in BigQuery opens several possibilities for developers and data scientists. Usage includes, but is not limited to, the following 
  • Analyzing visitor behavior across very large date ranges. Answer the question: "From 2010 to 2013, which sections of my site had the most volatility in daily traffic volumes?"
  • Joining against data from other sources. Make detailed, custom analyses, such as: "I have a database that contains all the metadata about each article posted on my site and would like to see the bounce rate, conversion rate and new visitors generated by author and topic."
  • Understanding complex queries. Answer the question: "Of the visitors to my site that used a voucher code, how many originally discovered my brand from a voucher code site and how many left the checkout process and returned within 10 minutes with a voucher code? Which codes were used in each case?"
  • Integrating with Data Warehouses. Make detailed, custom analyses, such as: "On a weekly basis, for each of my logged in customers, I want to see the top 5 products that they viewed but did not buy and add that information into their record in our CRM."
We are looking forward to getting this granular data access into the hands of developers and data scientists. To receive more information about this integration as it comes available, developers may register their interest here: http://goo.gl/QJR9Y.

Posted by: Clancy Childs, Product Manager, Google Analytics Premium 
Last year at I/O we launched Mobile App Analytics, a re-imagining of app analytics from the ground up, speaking the language that matters to app developers and marketers. Since launch, the insights provided are already helping hundreds of thousands of app developers and marketers create more successful Android and iOS apps and experiences by measuring metrics at all stages: acquisition, engagement and outcomes like in-app purchases. 

This year at I/O, our team continues to improve mobile analysis with two announcements: Mobile App Analytics Play Integration and Google Tag Manager for Mobile Apps. These updates, to be available for all users shortly (with links below to help you get on early whitelists) will let you better measure a mobile world and use your data in more ways to improve the customer experience. 

Better understand the total picture of your app users with Google Play Integration

We’re excited to announce a long-anticipated integration of Mobile App Analytics more deeply with Google Play. It’s especially exciting for app developers and marketers because it’s the first time we’re presenting a complete view of the Play acquisition funnel in one clear, easy to understand report.

The data sources you’ll be able to see include:

Google Play traffic sources: understand which traffic sources and Google search keywords account for most new users. Campaign sources will help you refine your app marketing mix in order to focus on those campaigns and programs that bring the highest quality traffic. 

Google Play views: at the very top of the app funnel, you’ll want to understand clearly how many views your app is receiving in Google Play from each campaign or source. 

Installs: installs simply shows the number of users who actually installed your application from Google Play. It’s useful here to determine which sources are successful at driving installation. 

New users: beyond installs, new users shows you how many users actually launch your application. This is a key metric to see even beyond installations and tracing the path up the funnel.

As this report is using flow visualization, you can also select any path you wish to analyze further which will highlight that path and present useful data points along the funnel such as drop off rate.

Google Tag Manager for Mobile Apps

Ever want to make a small tweak to your mobile application but your users have already downloaded your app? Ever forget to add analytics to a key event until it’s too late? Shipping your app usually means you have one chance to get it right, and that’s not the best way to build a business.


With Google Tag Manager for Mobile Apps launching in beta, you can dynamically configure your mobile applications on Android and iOS server-side. You can hone your app for various audiences, and you’ll never get caught by old versions or forgetfulness again.

Google Tag Manager for Mobile Apps uses Google Tag Manager’s sophisticated rule-based serving engine  and easy-to-use management interface to make it a snap for developers to make changes to their applications, even after an app has been downloaded by users. Now changing the configuration of your application or rolling out a new feature is as easy as going to the Google Tag Manager web interface, changing a couple of values, and then pressing a Publish button. Changes go live in seconds.

You can configure virtually anything in your application: from ad values such as frequency and duration and UI settings like colors and layout, to time-based events such as in-app promotions and special events. Sign up for the whitelist to be among the first to try out GTM for Mobile (you’ll need to first visit the Google Tag Manager site and create an account if you haven’t already).

We’re excited to continue to push the envelope with what analytics can do across devices and platforms and cater to developers with tools they want.

Posted by the Google Analytics Team  

Tuesday 14 May 2013

We’ve been working hard getting ready for Google I/O! We're livestreaming our presentation on how to optimize web and mobile apps across devices using Google Analytics on Thursday, May 16 at 1:40pm PT and we’d like to invite everyone to join us.

We recently launched Universal Analytics, a new way to measure user interactions across any device / platform / environment. By measuring this data, developers can better optimize their applications. In this session we'll discuss how to measure user-interaction from any device as well as demo new reports and best practices to optimize both web and mobile apps.

For those of you who are going to be at I/O, please stop by the Ads sandbox and say hi to the Analytics team! We’ll be around to answer questions, and we may even have some pretty cool Analytics gear to give out. Be sure to check out all of our Analytics sessions. You can find the full schedule here.


Thursday 9 May 2013

One powerful feature of Google Analytics is the ability to create filters to limit and modify the traffic data that is included in a profile. Custom filters can be made on specific fields of data; our users have long been asking for more data to filter, especially for mobile and social. We have listened, and are glad to announce an expanded fields list. Full descriptions of the new fields and values are documented here, and following is a summary:

Mobile
  • Is a mobile device
  • Is a tablet
  • Mobile brand name
  • Mobile model name
  • Mobile marketing name
  • Mobile pointing method
  • Mobile has QWERTY keyboard?
  • Mobile is NFC supported?
  • Mobile has cellular radio?
  • Mobile has wifi?
Social 
  • Social network
  • Social action
  • Social action target
Content & Traffic
  • Hit type: (page, social, transaction, etc.)
  • Internal search term
  • Internal search type
Audience / Users
  • Browser size
  • IP version
E-commerce
  • Local currency code
Use these new filter fields for improved data analysis and for more refined and targeted reporting views.

Posted by Matt Matyas, Google Analytics Team

Monday 6 May 2013

Ariat is the leading equestrian footwear and apparel brand in the United States. Their website - Ariat.com - is an ecommerce sales channel, a branding tool, and a medium to feature their channel partners. Its goal is to facilitate the entire buying cycle from awareness to loyalty. 


In 2010, Ariat invested heavily in digital by creating a powerful new website. In order to justify the cost and report a return on investment, the new website would require a comprehensive web analytics and reporting program. Beyond just evaluating key performance indicators (KPIs) for e-commerce, such as revenue and conversion rate, Ariat needed to measure the effectiveness of their new merchandising and promotional features, and also the effectiveness of various digital marketing channels. 

Ariat reached out to SwellPath to assist in the evaluation of analytics tools and general consultation on the measurement strategies for their new site. SwellPath determined that Google Analytics was the right tool for the job, based on its flexible measurement capabilities and advanced analysis tools. They then created a custom measurement strategy and analytics framework to align the data with Ariat’s business goals. This framework ensured that they could measure the effectiveness of their internal promotional campaigns, shopping tools and product page features, and all digital marketing channels. 

SwellPath also introduced Ariat to “micro-conversion” metrics. These are actions that may not be a straightforward goal completion, but rather support the conversion process or have  their own inherent value. For Ariat, this included email signups, sharing content with social media buttons, and outbound clicks to channel partners.

Ariat’s new website launch has been a huge success thanks to data-driven improvements  made from the very beginning. Being able to measure and optimize the many features of the shopping experience allowed them to identify improvements that decreased cart abandonment by 18% and increased conversion rate by 14%. Acting on these opportunities so soon after launch allowed them to save large amounts of potentially lost revenue, and avoid customer irritation through a simpler checkout experience. 

Merchandising promotions on the homepage were also optimized based on insights from custom analytics data. The ecommerce conversion rate for visitors interacting with these promotions rose over 80% from 2011 to 2012. Consistent digital campaign tracking and attribution analysis identified key success factors in email campaigns, social media marketing, and display campaigns. This allowed for optimal budget planning and campaign optimization resulting in a 14% year-over-year increase in the ecommerce conversion rate for those campaigns, and a 17% increase in per-visit value.

Using advanced analytics and measurement tactics with Google Analytics allowed Ariat to quantify the improvements to their website, revealing a fantastic ROI and providing many opportunities for future growth.

Check out the full case study here [PDF]

Posted by the Google Analytics team

Thursday 2 May 2013

Over the past year, we’ve been making continued improvements to the Real-Time reports in Google Analytics. Significant updates include real-time now supporting profiles, 4 key analysis improvements as well real-time widgets available for dashboards.

But have you ever looked at your real time report and thought, “wow check out how many visitors I have today, I wonder if any of them are converting?” We had that same question and so we are happy to announce the beta launch of our new real-time goals report! Now you can monitor in real-time how many of your website visitors are converting and against what goals. 


Use this feature to track the live results of how your new email newsletter, ad campaign or TV commercial is performing. An important note, with this first launch we’re introducing URL based goals only. So computed goals such as Time on Site or Pages / Visit are not included yet. For ease of use, you will see all goals that are being tracked in the UI regardless of whether there have been any completions in the past 30 minutes.

As with the rest of the real time reports, clicking a specific goal will automatically segment that report. Basic filters also apply to goals so you can analyze goal completions from a specific location or other dimensions you care about.


So now, the next time content on your site goes viral, you get a hot mention in the media, or large social traffic spike be sure to check out your real-time goals report to see in real-time the bottom line impact.

Happy Analyzing,

Posted by Linus Chou, Product Manager, Google Analytics