The following is a guest post contributed by Daniel Waisberg, Owner of Conversion Journey, a Google Analytics Certified Partner, and Founder of Online Behavior, a Marketing Measurement and Optimization portal.
Abraham Lincoln once said: "If I had eight hours to chop down a tree, I'd spend six hours sharpening my axe." The same is true for measurement: it is of extreme importance to spend the necessary time thinking through which data should be collected and whether the collection works as planned (once implemented). Very often, the implementation model and quality assurance do not receive the proper attention.
I recently wrote a short eBook named Google Analytics Implementation Best Practices that covers some of the most important configurations you should setup. But in this post I will go through some techniques that will help you to make sure your Google Analytics implementation is working as you expect.
1. Create a "Raw Data" profile
The best way to check configuration errors is to have a profile that does not use any filters, this way you will be able to quickly learn if you have a misplaced or problematic filter. Here is a quick guide explaining how to create profiles.
Once you create this profile, I do recommend you create the same goals you have in your main profile, this will make the data more relevant in case you need to use it. For example, if you find out that your main profile have a filter that affected your past data, you might want to use the Raw Data profile for a while. To copy and paste a goal between profiles you can use the Chrome extension GA Copy and Paste.
2. Use Real Time Reports
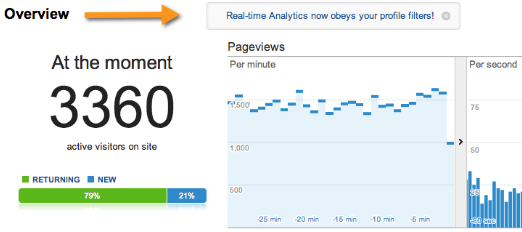
In October 2012 Real Time reports started supporting profile filters. This means that "the data you see in real time is profile specific and obeys the filtering you set up for that profile. And this means any user with access to a profile can view the associated real time reports." This enables many interesting analysis opportunities like seeing real traffic for only small pre-defined segments.


In order to use Real Time to check your Google Analytics implementation, you should first create a new profile (see link above). Then, add a filter that includes the IP address of your company; learn how to do it in this help article, but make sure to change the filter from "exclude" to "include". Now you will be able to look at the Real Time reports of this profile and see what you are doing in real time, which makes code checks much easier and faster.
3. Keep Track Of Configuration Changes
One of the common configuration problems is a lack of communication, especially for large companies. From a few people to a few dozen people will have Admin access to Google Analytics, which means they can change the settings of any profile. This can lead to unwanted or misunderstood changes in the account.
By "changes" I mean goal refinements, filter improvements, new features, and so forth. Every change may impact data in several ways, and for this reason it is essential to have a system in place to keep track of code and profile changes. In order to facilitate/centralize the collection and sharing of the changes made to a Google Analytics account, I propose two different methods: using a Google Docs form & taking advantage of the Annotations feature. Please note that each company should find the optimal mix between these methods.
Using a Google Docs Form
The big advantage of Google Docs is that it can be shared with as many people as needed and everyone has access to the most updated version of the document. I recommend creating a Google Form (learn how) that will output its data into a spreadsheet. The form should be created so that all interested parties can be aware of all changes. These will then be aggregated for historical knowledge that can be used by the whole team (and future teams members). See one sample form that can be used by Analytics teams in this article.
Google Analytics Annotations
This feature allows website managers, marketers and developers to provide context directly from inside the graphs on the interface, allowing for richer analyses. Here are some important occasions when you should use this feature:
- Offline marketing campaigns (e.g. radio, TV, billboards.)
- Major changes to the website (e.g. design, structure, content.)
- Changes to tracking (e.g. changing the tracking code, adding events.)
- Changes to goals or filters.
While annotations can (and should) be used for technical changes in the website, it is important to keep them at a high level. You shouldn't add detailed information about your changes or annotate relatively minor changes; otherwise the annotations will become too crowded to convey meaningful information to readers.
4. Know What Your Site Sends To Google Analytics
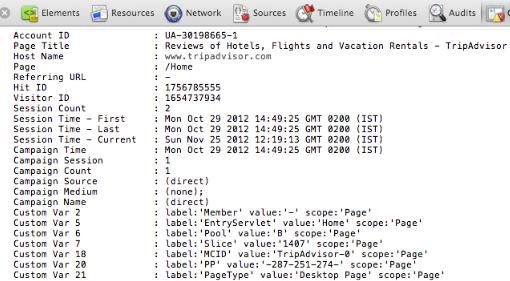
The Google Analytics team built a Chrome extension that is intended to help you debug your implementation. Here is what you will be able to do using the extension and a screenshot of how you will see the data:
This extension loads the debug version of the Google Analytics Javascript for all sites you browse using Google Chrome. It prints useful information to the Javascript console. These messages include error messages and warnings which can tell you when your analytics tracking code is set up incorrectly. In addition, it provides a detailed breakdown of each tracking beacon sent to Google Analytics.

Important tip: this extension can also be used for competitive analysis. If you use it while browsing your competitors' websites you will learn how they are tracking their customers.
5. [E-commerce sites] Compare Google Analytics to Database
The most important feature on Google Analytics for Ecommerce websites is the Ecommerce Tracking. It allows the marketer and website owner to understand what and who is driving online sales. But it is essential that the numbers on Google Analytics approximately match the database of the company, otherwise they won't be trusted.
In order to make sure the numbers match, ask from your Database administrator to retrieve the daily Ecommerce revenue for a month, and extract the same information from Google Analytics. Plot the numbers on your preferred spreadsheet tool and check if the numbers and the trends match. If they do not match, here is a quick list of things to check:
- When 2 or more of the same item are purchased, does Google Analytics trigger _addItem more than once? (it should)
- How does Google Analytics record transactions that use promotional coupons and how the database reports it?
- Be careful with apostrophes! If you use apostrophes in your product names you should be careful not to pass them to Google Analytics on the _addItem, they can break your code.
Closing Thoughts
As we saw above, there are several tools that can help you understand why the data you are getting might not be what you expected. But if you still can't find a solution to your issue, try asking a question at the User Forum. I also highly recommend you read this code website article: Troubleshooting the Tracking Code.
Happy analyzing!
Posted by Daniel Waisberg,


