Thursday, 28 March 2013

Real-time reports provide useful insights for businesses that help them understand how their systems are reacting, instantly, such as when you send out an email campaign or engage in marketing that has a temporal nature. It provides alerting / intelligence, giving insight into things that are new or different such as a sudden increase in site traffic. Real-time also lets you win social by capitalizing on trending topics. For example, if you noticed a blog post you published previously is suddenly gaining attention due to something happening in the news, you could highlight it on the front page of your site to draw additional attention and ‘pour fuel’ on the social fire. 

Today, we're announcing 4 improvements to real-time reports. You can now:
  1. Analyze Events in real-time
  2. Breakdown real-time by Desktop/Tablet/Mobile traffic
  3. Create shortcuts to your favorite real-time segments
  4. Compare real-time filtered data against overall real-time data
Let’s go through the changes in more detail:

1. Realtime Events Report
With the real-time events report, you can now not only see the top events as they occur but also filter on particular event categories (and actions). Additionally, you can see whether particular segments of visitors trigger different events and debug your events deployment in real time.

To access this report, navigate to the real-time section of Google Analytics and click on the Events section. You should see a report similar to this:
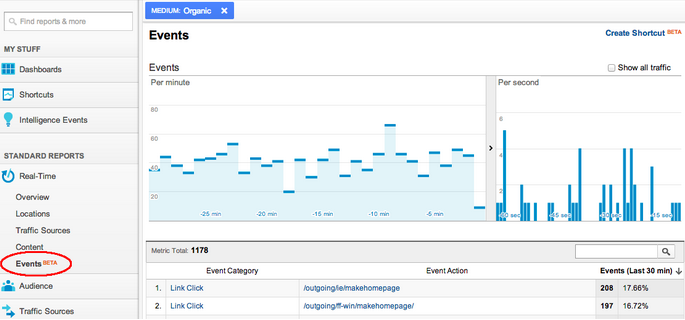

Clicking on any of the Event Category will drill down and show all the Event Actions and Event Labels for that particular category.

If you are trying to see what events a particular segment of visitors generate, that is easy as well. Any filters you set up in any part of real-time are preserved in the Events report. For example, in the above screengrab we have set up a filter here to see what events are triggered from visitors coming via organic search.

2. Content Breakdown by Desktop/Tablet/Mobile
We live in an increasingly multi-screen world, and now you can see in real-time the type of device that visitors are using to visit your web site (desktop, tablet and mobile). This is available in the content report as shown below:


As with real-time reports, you can easily see your visitors filtered by the device type (by clicking on either of “Desktop” “Tablet” “Mobile”).

3. Shortcuts for your important real-time segments
We’ve heard from users that you like to look at certain segments of visitors in real-time, but dislike setting up the filters each time. Now, you can use the “Create Shortcut” feature to store your favorite segments. 


Now all you need to do is open up Shortcuts from the left navigation menu and click to any of your shortcuts.

4. Comparison real-time to overall data
Finally, you can compare the pageviews of your segmented visitors to overall traffic as shown below. This is nifty if you want to see quick comparison trends. For example, many times, after a G+ post, I create a filter by device type of “Mobile” and can see that the mobile traffic picks up much faster and also contributes more to the initial increase in pageviews.


Stay tuned for continued improvements to real-time, a growing area of importance for your digital marketing.

Posted by the Google Analytics Real-Time team

Tuesday, 26 March 2013

We’ve redesigned the Google Analytics Social Reports to make it easier to see the conversations and activity happening surrounding your content on our Social Data Hub Partners. We’re introducing 2 new reports that make it easier to consume this data:
  • Data Hub Activity
  • Trackbacks
The activity stream was previously available via drill down from the Network Referrals or Landing Pages reports. We have now made it a standalone report. By navigating to the Data Hub Activity report you’ll see a timeline of the number of activities that have occurred in the Social Data Hub and the raw activities in a list below. You can also filter this list by any specific networks you choose. 

We’re also excited to announce that Trackbacks are now available in a standalone report. Trackbacks are all of your inbound links across the web, so you’ll be informed if anyone from a small to blog to the New York Times posts a link to your site. Additionally, we are providing context for the significance of each of these trackbacks by displaying the number of visits that were driven by each endorsing URL during the reporting period. You’ll see this number presented alongside the trackback. 
Image via Google’s Analytics Advocate, Justin Cutroni 
Give them a try and happy analyzing!

Posted by Linus Chou, Product Manager, Google Analytics

Friday, 22 March 2013

A typical consumer today uses multiple devices to surf the web and interact in many ways with your business. For most large businesses, already swimming in many sources of data, it’s an enormous challenge, but also an incredible opportunity. 

Back in October, we announced the limited beta release of Universal Analytics as a way for businesses to understand the changing, multi-device customer journey. Today, we’re excited to welcome and invite all Google Analytics customers to try Universal Analytics.


The benefits of using Universal Analytics to businesses are: 
  • Understanding how customers interact with your businesses across many devices and touch-points, 
  • Insights into the performance of your mobile apps
  • Improvements of lead generation and ROI by incorporating offline and online interactions so you can understand which channels drive the best results,
  • Improved latency on your site by reducing client-side demands.
Testimonials from the initial beta release
Our initial beta customers using Universal Analytics and are pleased with their results. Rojeh Avanesian, VP of Marketing at PriceGrabber.com reports:

"At PriceGrabber, we know it’s important to understand consumer shopping behavior so we can provide a more customized experience to our users. Google’s Universal Analytics will solve this problem for us and many sites that are facing this challenge and help us serve our users better by providing them with more relevant content and shopping results. We can use Google Analytics metrics to segment our users in a way that improves and simplifies the shopping experience for consumers. That’s what we strive for at PriceGrabber, to make shopping and saving money as easy as possible."


How to get started using Universal Analytics
If you’re new to Google Analytics, you can choose Universal Analytics when you setup your account. Already using Google Analytics? Create a new web property in your Google Analytics account to set up Universal Analytics and explore the new features. 

Here’s what you’ll see when you create a new web property. Select the Universal Analytics column to get the new analytics.js code snippet you can implement on your website:


You can implement Universal Analytics with the new analytics.js JavaScript for websites, our iOS and Android SDKs for apps, and the new Measurement Protocol for all other platforms. 

Find more details on how to set up using our help center or developer guide. (Migration guides for properties using ga.js coming soon. Until then, set up a new property in your account for Universal Analytics).

To tag in the most flexible way possible, you can also take advantage of the Universal Analytics template available in Google Tag Manager, which allows you to make additional changes and enable new features to your analytics setup without changing the hard-coded tags on your website. Learn more about how to implement Universal Analytics through Google Tag Manager

For more information on Universal Analytics, visit our help center and developer guides

Happy analyzing - in the new and innovative ways you can with Universal Analytics!

Posted by JiaJing Wang, Product Manager, Google Analytics