Tuesday, 22 November 2011

Is your website performing as well as it could be? Do you want to get more out of your digital marketing campaigns, including AdWords and other digital media? Do you feel like you have gaps in your current Google Analytics setup?

We’ve heard from many of our users who want to go deeper into their Analytics -- with so much data, it can be hard to know where to look first. If you’d like to move beyond standard “pageview” metrics and visitor statistics, then please join us next Thursday:

Webinar: Reaching Your Goals with Analytics
Date: Thursday, December 1
Time: 11am PST / 2pm EST
Sign up here!

During the webinar, we’ll cover:

  • Key questions to ask for richer insights from your data
  • How to define “success” (for websites, visitors, or campaigns)
  • How to set up and use Goals
  • How to set up and use Ecommerce (for websites with a shopping cart)
  • How to link AdWords to your Google Analytics account

Whatever your online business model -- shopping, lead-generation, or pure content -- these tools will deliver actionable insights into your buying cycle.

This webinar will be led by Joe Larkin, a technical specialist on the Google Analytics team, and it’s designed for intermediate users of Google Analytics. If you’re comfortable with the basics, but you’d like to do more with your data, then we hope you’ll join us next week!


Friday, 18 November 2011

Speed matters. Faster loading pages mean more visitors land on your site instead of waiting in frustration or leaving. The Google Analytics Site Speed report will help you learn which of your pages are underperforming, so you can address this potential barrier to your conversions.

The Site Speed report was launched a few months ago, but it required site owners to add an additional Google Analytics tracking code to see data in this report. Based on increasing user requests we are now making this feature available to all Google Analytics users and removing the requirement to modify your Google Analytics tracking code. As of today all Google Analytics accounts will automatically have the Site Speed report available with no extra work required from you.


Want to check out Site Speed in your account? It’s easy. Go to the content section and click the Site Speed report. There are three tabs within the Site Speed report for you to review: Explorer, Performance, & Map Overlay. Each provides a slightly different view of your site speed performance. The Explorer tab provides an overview of load time by page. The Performance tab buckets your site speed performance by page load time. The Map Overlay tab provides a view of your site speed experienced by users in different geographical regions (cities, countries, continents). Below are snapshots of the Performance & Map Overlay tabs.


If you have already been using the Site Speed report through the additional tracking script, you can keep using the report as before. Since the tracking code “ _trackPageLoadTime” is no longer required to enable Site Speed report, going forward Google Analytics will simply ignore it.

Interested in understanding the details of the Site Speed report sampling rate, tracking of virtual pageviews, and impact of redirects?
  • Sample rate - Google Analytics samples your page load times to generate this report. For the more technical minded users you can adjust this sampling rate by adding to your Google Analytics code the function - setSiteSpeedSampleRate
  • Support for virtual pages - If a virtual path was used in the _trackPageview call, that path will now also be associated with any site speed data collected from that page.
  • Redirection time - Redirects are now counted as part of the "page load time" metric, so it represents the total time a user perceives of your site loading. Current users of the Site Speed report may notice a small increase in page load times as a result of this update.
Still have questions? Check out the Google code site and Help Center articles on Site Speed. We hope you’ll gain insights from this newly updated report and be able to use it to optimize your pages.  Please share with us your thoughts on this report and any suggestions for future updates. 

- Nir Tzemah, Google Analytics Team

Friday, 11 November 2011

Starting this week, some of you will see enhanced Analytics reports with mobile ad performance metrics. All AdWords reports in the new interface will be gaining a new visual toggle as shown below for “All”, “High-end Mobile” and “Tablet” ads.  All AdWords metrics available in Google Analytics can be segmented by these new mobile and tablet dimensions.


As more consumers begin to make use of tablets or high-end mobile devices, businesses need to understand this shift towards mobile and adapt your marketing mix. This mobile ads reporting enhancement in Google Analytics is one of many steps that we are taking towards helping you make more sense of how mobile advertising interacts with your business.

Please let us know what you think, and suggest any other mobile measurement options you’d like to see that help make sense of your mobile advertising effectiveness.

- Phil Mui, Google Analytics team

Wednesday, 9 November 2011

It’s quite common for organizations to have complex reporting requirements that combine multiple data sources. In these cases, an efficient way to get at Google Analytics data is to use the API. But for those without the development resources needed to access the API there are many Google Analytics Apps available that can offer a solution. The following mini case study is about Analytics Canvas, a 3rd party Google Analytics App. Analytics Canvas helped Fairmont Raffles Hotels International take a complex reporting task and make it easy.

Like most global organizations, Fairmont Raffles Hotels International has regionally operated business units. Each unit typically maintains its own reporting profile in Google Analytics. But with individual business unit profiles, how do you analyze the data across all the business units? And, how do you combine external business data with each of these Google Analytics profiles?

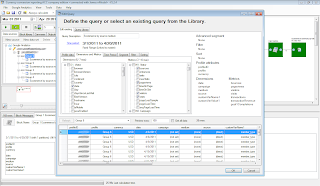
For Fairmont Raffles Hotels International, the answers lie in the Analytics Canvas tool from nModal. Analytics Canvas is an easy to use, drag-n-drop interface for creating data queries and transformations needed for advanced reports and dashboards. Analytics Canvas can extract data from multiple Google Analytics accounts, combine it with additional data sources, and then segment and filter the data.


Barbara Pezzi, Director Analytics & Search Optimization, Fairmont Raffles Hotels International, uses Analytics Canvas to automate her complex reporting tasks. “We trade in over 10 different currencies on our websites. We needed to have multiple international hotels’ eCommerce data converted to a common currency in various reports, such as ‘All Traffic Sources’ and ‘Campaigns’, to analyze the overall production of each traffic channel and marketing initiative. Traditionally we would have to export data from multiple profiles and do currency conversion by hand in spreadsheets. With almost 100 hotels, the large number of profiles made it a very time consuming and potentially error prone task to get a multi-hotel, single currency report.” With Analytics Canvas, Fairmont automated this task in minutes with a single currency report for all its hotels.


Analytics Canvas was built by nModal Solutions Inc using the Google Analytics API. Here is what James Standen, the founder of nModal, has to say “The Google Analytics API is very easy to use and the full access to data makes it possible to make a very powerful query interface. So far we’ve had a great response to Analytics Canvas. People are very pleased to have greater access to their web traffic data, and we’re thrilled to hear about the interesting new applications and integrations our customers are able to do using our tool.”

The Analytics Canvas application can be found through the Google Analytics App Gallery and can be downloaded from the Analytics Canvas website.

If you’re interested in developing applications for the Google Analytics platform visit Google Analytics for Developers.

Monday, 7 November 2011

Welcome to another delightful episode of Web Analytics TV! Web Analytics TV, as you well know by now, is powered by your amazing questions. In this wonderful episode we had questions from Australia, Denmark, India, Sweden, Germany andThe Netherlands.

If you’re new to this show, our process is simple.


Step 1: You ask, or vote on, your favorite web analytics questions. Vote on next week’s questions using this Web Analytics TV Google Moderator site.

Step 2: From a secret undisclosed location at the Googleplex Avinash Kaushik & Nick Mihailovski answer them. :-)

In this episode we award the “Ninja of the Episode” and award it to Niklas in Sweden, for a great question about the difference between events and custom variables. Niklas, just email us and we’ll send you a signed copy of Web analytics 2.0.

OK. Here is the list of last episodes questions.

In this action packed episode we discuss:
  • (0:23) Best practices for rollup reporting across multiple sites (See answer below)
  • (0:53) Reporting secure search in Google Analytics
  • (3:27) Troubleshooting funnel navigation reports
  • (4:31) Comparing using event tracking and session level custom variables.
  • (6:28) Measuring how visitors who interact with a video influence conversions
  • (7:35) When data in Google Analytics updated
  • (9:55) Representing multiple date ranges by column
  • (11:04) Best practices for tracking widgets
  • (11:40) Exporting greater than 500 rows from Google Analytics
  • (13:43) Comparing days to purchase by medium
  • (15:20) Using multiple tracking codes on the same page (see answer below)
  • (16:25) Best practices using custom variables to track multivariate test information
  • (18:10) Reporting across multiple currencies in Google Analytics
  • (19:10) Segmenting 'serious' visitors by loyalty and engagement metrics
  • (21:32) Measuring click to call buttons in your mobile websites
  • (22:45) The best and most time efficient way to put Google Analytics data into a powerPoint
  • (23:47) Tracking cross-sells or up-sells on a product page
  • (26:05) Tracking multiple ids or paths per page
  • (26:45) Why single page website show time on site metrics
  • (28:27) Using the reverse page path report for analysis
  • (30:21) Do profile filters impact site search reports
  • (32:39) How to get fast traffic in your reports


Here are the links to the topics we discuss:
There was one question asked which we needed to get more information. 

“What is your recommendation to simultaneously track data for a local site & having a roll-up profile to track aggregate data across all sites of a company.”

What we learned was that there are 25+ sites on different domains split across 2 business units. A simple solution is to pull out data using the API to create any rollup reports you need. Another option is to have multiple tracking codes on the same page, and have one code be the same across all the sites. That way all the data is sent into a single report which you can view.

One thing to keep in mind, is that each site will track visitors separately. So visitor numbers will not be accurate across all the sites.

So hopefully this helps you out. As always, if you need help setting up Google Analytics or leveraging the advanced configuration options, we recommend hiring a Google Analytics Certified Partner.

If you found this post or video helpful, we'd love to hear your comments. Please share them via the comment form below.

This series would not be possible without your awesome questions. Please submit them on our public Google Moderator site, and while you’re there don’t forget to vote for your favorite questions.  Avinash and I will answer them in a couple of weeks with yet another entertaining video.


Tuesday, 1 November 2011

Two of the most requested features from the old version of Google Analytics that have been absent in the new interface are report email scheduling and PDF export.  We are happy to announce that both email scheduling and PDF export functionality will be the new interface in a few weeks.

Because there are significant differences between reports in the new and old versions of Google Analytics, we would like to use this opportunity to solicit your feedback regarding which scheduled email reports should be preserved in the new version. We suspect that many of you would like to use this opportunity to “reset” the number and types of scheduled Google Analytics emails. As we roll out the new email system in the coming few weeks, we encourage you to examine your existing scheduled emails and make a personal decision on whether to recreate a similar scheduled email report.

Every standard and custom report will have an email scheduling option, shown below in the report options bar:


Clicking on the “EMAIL” button pulls up the following email scheduling dialog:


(A more detailed blog post about the emailer and its new functionality will be available when the it is released in a few weeks.) The above email preview shows the work we have put into improving the email report setup over the older Analytics interface.

PDF export for every report will also be available within a few weeks.

With the upcoming release of both the new emailer & PDF download, we want to give you three months notice (as of today) that the old Google Analytics interface as well as all existing scheduled emails will be sunset starting in January 2012. We believe that the new Google Analytics interface provides significant advantages over the old version, including access to Real Time Analytics, Multi-Channel Funnels, Social Plugin Analytics, & Flow Visualization. And hope you'll find enough value in these new features that you'll switch to the new version well before then.

We welcome your feedback and comments.

- Phil Mui, Google Analytics team