Thursday 28 May 2009

We've noticed some misconceptions about Google Analytics floating around, and we thought we'd take a shot at correcting the most common ones. Without further ado, here they are, the top ten myths about Google Analytics debunked.

MYTH 1: "You get what you pay for." Google Analytics is free, which means the system is down a lot.

Google Analytics makes use of the same network of secure and reliable data centers used to power Google.com, making downtime an extremely rare occurrence. We have a large team focused exclusively on keeping your data safe and accessible, and benefit from multiple redundancies in our infrastructure around the globe (this makes us fast as well).

We even rely on Google Analytics for our own mission-critical products such as AdWords, which see huge volumes of traffic every day. If you're still having doubts, we'd encourage you to talk to some users and ask them how their experience has been with uptime.

MYTH 2: Google Analytics is basic and doesn't have any "advanced" features or metrics


Ack, this one is a tough one to swallow! A more frequent complaint is actually that Google Analytics has too much data. The product includes over 90 standard reports with more than 125 metrics and dimensions covering everything from visits to internal site search queries.

Custom reports and user-defined variables allow you to create your own metrics and reports where the standard ones don't meet your needs. With Pivoting, Advanced Segmentation, Secondary Dimensions, Event Tracking and the ability to share customizations, Google Analytics reports are more powerful than ever.

Google Analytics may look "basic," on the surface, but it can do a lot more than you think! If you have complex needs try talking to a Google Analytics Authorized Consultant or diving into the documentation on the Google Code Site.

More Info (Feature List, Custom Reports, Advanced Segmentation, Analytics API)

MYTH 3: Google Analytics only supports third-party cookies

False! Google Analytics has always used first-party, not third-party cookies. First-party cookies are important because they allow Google Analytics to track repeat visitors, so you can see which keyword, referring site, etc is responsible for bringing buyers even when it takes multiple visits for them to convert.

MYTH 4: Google Analytics is not really accurate

If you've spent time doing web analytics work, you'll know the sinking feeling that comes when two sets of numbers don't match. If you're experiencing a data discrepancy, don't panic. There are many others in the same boat.

Google Analytics uses JavaScript tags to collect data. This industry-standard method yields reliable trends and a high degree of precision, but it's not perfect. Most of the time, if you are noticing data discrepancies greater than 10%, it's due to an installation issue. Common problems include JavaScript errors, redirects, untagged pages and slow client-side load times.

For tips on how to sensibly approach data reconciliation, check out this post by Avinash Kaushik, Google's Analytics Evangelist, or this whitepaper on accuracy in Google Analytics. You can also talk to an expert.

All web analytics tools face the same technical limitations posed by JavaScript tags, so if another vendor claims their tool is more accurate, ask for some evidence.

More Info (Web Analytics Data Reconciliation Checklist, Whitepaper)

MYTH 5: It's not possible to export your data from Google Analytics

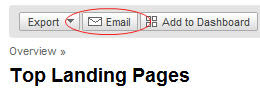
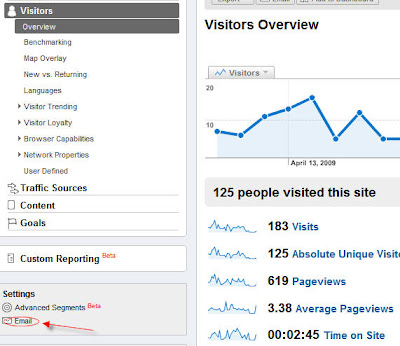
Not true! You have two options for exporting data. Use the "export" button at the top of each report to export the current view in PDF or XML (up to 500 rows). Or, use the new Analytics Export API to extract large amounts of data in any format you like. Also, if you want to share data with a colleague, you can schedule reports to be delivered directly to their email inbox, or even send regular updates to your own email address.

More Info (How to Export your Data, Analytics API)

MYTH 6: With Google Analytics you can't control your data

You have three options for data sharing in Google Analytics. You can change these options at any time from inside your Analytics account.
  • do not share your data
  • share your data with Google to improve its products
  • share your data anonymously for benchmarking

No matter which option you choose, your data is protected by several layers of defense:
  1. Dedicated security and infrastructure teams
  2. Multiple redundancies to prevent data loss
  3. Network redundancies to keep data accessible
  4. Advanced security, firewalling and routing to keep data secure
  5. Restricted access and principle of least privilege for personnel
If you opt-out of data sharing, your data will remain within Google Analytics and will not be shared with other products or services. If you decide to share your data with Google, it will be used to improve those products and services. Lastly, if you decide to share your data anonymously with others, it will be blended with other data to support the Google Analytics benchmarking feature. For more information on these options and what they mean, refer to the Google Analytics data sharing FAQ.

If you're still concerned, Google also offers a software product called Urchin (www.urchin.com) that you can run locally.

More Info (Data Sharing FAQ, Google Privacy Policy)

MYTH 7: There is no professional support for Google Analytics

Contrar! We flipped the model. Instead of providing an expensive analytics product with a one-size-fits-all professional services plan, we provide a free product and let you purchase the professional services that fit your needs.

There are several ways to get support: email support, help forums, the help center, and a network of Authorized Consultants. Authorized Consultants speak your language, accept your currency and often share your timezone. More than 80 companies across the globe provide a full range of installation and analysis support for Google Analytics. Some examples of things they can help you with are:
  • Validate and troubleshoot your installation
  • Integrate your analytics data with other data sources or CRM
  • Optimize your marketing efforts
  • Train your staff on how to use Analytics
  • Respond to support tickets, phone calls and provide on-site consulting
To find out more, give one or two of them a call. Our Authorized Consultants are hand-picked and are the best in the business.

More Info (Google Analytics Authorized Consultants)

MYTH 8: Google Analytics does not support A/B or multivariate testing and isn't well-integrated with other tools

Google offers a full range of marketing products including a free testing tool called Google Website Optimizer. You can use it to test different page elements and find out which ones yield the highest conversion rate and ROI. You can also use Google Analytics in conjunction with Website Optimizer to create an optimization plan for your site.

Google Analytics is also integrated with many of Google's other business products including AdWords, AdSense, and AdPlanner. It is also widely supported by third party tools ranging from content management systems, to email suites, to call center applications. In addition, you'll find many products that are complementary to Google Analytics including DoubleClick, TVAds, Webmaster Tools, Google Trends, Insights for Search, Feedburner, and more.

More Info (Google Website Optimizer, GWO Blog)

MYTH 9: You can't segment data in Google Analytics

In the fall of 2008, Google Analytics released three new Enterprise Features: Advanced Segmentation, Custom Reports and Motion Charts. Advanced Segmentation lets you segment visits by dozens of metrics and dimensions such as geographic location, time on site, referral site and much much more. You can create segments on the fly and apply them to virtually all the standard reports in Google Analytics as well as custom reports.


More Info (In Depth Look at Advanced Segments, Video)

MYTH 10: You have to spend a lot of money to get "real" web analytics

Getting a return from your Analytics data does take an investment. The most important investment to start with is making sure you or someone at your organization has the expertise and time to put your data to use. If at that point you still feel you need to pay more for a more complicated tool, that's OK, but remember that every dollar you spend on a tool takes away from money you could be spending on actually getting results, i.e. hiring or contracting a talented analyst (see the 90/10 Rule).

The question sometimes comes up, "if Google Analytics is free, what's in it for Google?" Google benefits from Google Analytics in two ways. First, if webmasters build better sites, it helps us connect searchers with the information they need faster. Second, if advertisers use Google Analytics, they are able to see their advertising ROI, which helps us demonstrate the value of Google AdWords. Both aspects have helped create a strong business case for Google Analytics over the years.

Google Analytics is getting more powerful with each new update, and you may be surprised by what it can do. Find out more by attending an Analytics Seminar for Success or talking to an Authorized Consultant in your area. If you're an AdWords advertiser, you can also speak with your Customer Service Representative.

More Info (90/10 Rule, Google Analytics Authorized Consultants, Seminars for Success)

Leave a comment

That's it for the top 10 myths. Still not convinced? Leave a comment and let us know!

Posted by Sebastian Tonkin, Google Analytics Team

Friday 22 May 2009

Almost everyone uses Google Analytics to calculate overall site traffic as a way to measure the value of their website.

Many users are clamoring for a simpler way to share their Analytics traffic data with their external stakeholders. These stakeholders, such as investors and advertisers, typically use data reported by other services to evaluate the performance of a company. Many times these estimates are significantly different than that from Google Analytics.

One way to share your Analytics data with everyone is to use our recent integration with Google Ad Planner. With this, you can replace Ad Planner traffic estimates with actual data collected by Google Analytics.

Now you can use the Google Analytics Data Export API to create your own integrations to share Google Analytics data with everyone. For example, if you use WordPress blogging software, you can display Google Analytics traffic data directly on your website using the new Analyticator plugin by Sprial Web Consulting.

Ronald Heft explains, "this plugin allows WordPress users to easily configure tracking and reporting of Google Analytics data without having to manually edit their WordPress template files. The plugin uses the new Google Analytics API to retrieve the unique visitor information and display it directly on your blog."

Example of the Analyticator plugin display

To use the plugin, download it from the WordPress plugin Website or just search for, "analyticator" in the "Add a New Plugin" section of the WordPress Administration page. According to Heft, Sprial plans to surface more Google Analytics API data, such as a summary dashboard of website statistics and a widget to display the most popular pages.

We're looking forward to watching the evolution of this plugin and excited to see the applications developers are building with the Google Analytics Data Export API.

Posted by Nick Mihailovski, The Google Analytics API Team

Wednesday 20 May 2009

Today we're excited to announce a new feature in Google Analytics, tracking for YouTube brand channels. YouTube brand channels allow partners and advertisers to have a hub of content on YouTube, where they can collect videos, publish playlists, and get YouTube users deeply engaged with their brand. Now brand channel owners can get fully enabled Google Analytics reporting on their channel as if it were their own site.

For more information, check out the newly launched YouTube Biz Blog.

Beth Liebert

Tuesday 19 May 2009

In this post, we'll explain what Goals are in Google Analytics, why they're useful, and how to set them up. Let us make two assumptions before we start. First, you know the rules of basketball, and second, you are a Lakers fan (or at least you know who the Lakers are).

Note that if you run an ecommerce site, Google Analytics has additional features to help you track purchases. For more information on this, check out how to configure ecommerce tracking.

Understanding Goals in Google Analytics


Goals (with a capital G) are a way to measure business objectives for your website in Google Analytics. Goals must correspond to a measurable action performed by your website's visitors, for example, a visit to a "thank you" page. This combination of a business objective and a measurable action make up a Goal. Here are some common examples.

Business Objective
Visitor Action
Success Measure
Generate Leads
Complete Contact Formform_submitted.html
Drive Loyalty
Sign up for Newsletter
subscription_confirmed.html
Drive Revenue
Complete a Purchasethankyou.html
Raise Awareness Whitepaper Download
download_redirect.html

To use a real world example, the Lakers objective is to win games, and the measurable action is scoring baskets. Keeping this goal in mind helps the team focus on winning and not worry about things that don't matter -- like the number of times the team is photographed or their average height. Goals serve this same purpose in Google Analytics.

Understanding the Goal Funnel

Usually the visitor action that's associated with a goal involves multiple steps. Together these steps make up the Goal Funnel, or the sequence of steps that lead up to the successful completion of a Goal. Like the Goal itself, each of these steps must correspond to a measurable action, such as a pageview of a specific page.

Here's a real world example. Let's assume that Phil Jackson, the Lakers head coach, wants to score more baskets using a specific play. The path for that play is as follows: Kobe Bryant passes the ball to Derek Fisher, Derek Fisher passed the ball to Pau Gasol, and then Pau Gasol scores.


In this example, the Goal is scoring a basket and the Goal Funnel is Kobe > Derek > Pau. The ball moves from player to player until either Pau scores (Goal completed) or they lose the ball (Goal abandoned).

Now pretend the Lakers players are pages on a website and the ball is the website visitor. From now on we will look at the players as the following:
  • Kobe Bryant: kobe-bryant.html
  • Derek Fisher: derek-fisher.html
  • Pau Gasol: pau-gasol.html
  • Point: point.html

How to set up a Goal and Funnel:

Step 1) Define your Goal Funnel

Navigate to your website, and move through through the steps required to complete your Goal. As you navigate, note down the URLs for each page in the sequence (or take screenshots).

If the sequence includes only one step (the Goal) than you don't need to define a funnel at all. If the sequence includes events other than pageviews (such as clicks), you will need to use virtual pageviews or another method beyond the scope of this tutorial.

In our Lakers example, the funnel is defined as:

Another example might be:

  1. start_registration.html
  2. enter_shipping_info.html
  3. enter_subscriber_preferences.html
  4. finalize_registration.html
  5. thank_you.html

Step 2) Configure Goal Settings for Each Profile

Log in to your Google Analytics account and then click "Edit" beside your profile. You will need to configure goals for each profile you want them to show up in.

Go to Conversion Goals and Funnel and click "Edit"


Set "Active Goal" to "On"


Set "Match Type" to to either "Exact Match," "Head Match," or "Regular Expression Match." In our example, we chose "Exact Match," because there is only one exact URL for our Goal page "point.html."

If you have multiple Goal pages, or multiple pages for one of the steps leading up to the goal, you might need to use a different match type. For more information about the difference between Head, Exact, and Regular Expression match, visit this Help Center article.

If your Goal has a specific dollar value, be sure to enter it under "Goal Value". You may need to look at your financial data to determine how much a Goal completion is worth to you.

Step 3) Define Your Goal Funnel

Enter the URL and a meaningful name for each step in your funnel. In our example the Goal URL is "/point.html" and the name we gave it is "Point." If you only have one step (the Goal) than you don't need to complete this section.


Step 4) Wait a Few Days and Analyze your Goal Performance

Your Goals will not work backwards, so you will need to wait for Goal data to appear in your reports. Once you have data to analyze, navigate to the Goals section and open the Funnel Visualization Report.

Now we can analyze the entire goal funnel or just an individual page.


This report shows

  • 356 visits entering the funnel (at kobe-bryant.html)
  • 88 visits in which the person moved from "kobe-bryant.html" to the next step in the funnel "derek-fisher.html"
  • 55 visits that completed the entire funnel and reached the Goal
Looking across the entire Funnel, it looks like Kobe Bryant is not doing a great job getting the ball to Derek Fisher, so the team should consider working on that part of the play. Derek's doing a great job getting the ball to Pau, so he'll get some more playing time. Overall, the play leads to a basket 15% of the time, which is below the average for the team, so Phil might consider scrapping this play for a new one (site redesign anyone?).

Summary

So there you have it. Goals and Funnels in Google Analytics let you see how well your website is living up to your business objectives. They also help you identify specific areas of your website to improve on. Overall, they're a crucial element in a successful web strategy.
  • Before implementing Google Analytics Goals, identify what your business objectives are for your website, and what visitor actions they correspond to.
  • Identify the steps visitors must go through to complete the desired action, and note down the specific pages that make up those steps.
  • Use this information to configure Goals and Funnels.
  • Take action on the data. Make simple design changes or try using Website Optimizer to make improvements.
Other Resources

Still have questions? Get help at the Google Analytics help forum. Or, leave a comment and let us know how you use goals.

Posted by Sebastian Tonkin, Google Analytics Team, and Allaedin Ezzedin of E-Nor, a Google Analytics Authorized Consultant

Monday 18 May 2009

One way Google Analytics can help you quickly spot trends and anomalies is through the 'Graph mode' feature. This feature lets you compare multiple metrics on your graph to see if there are any obvious correlations. You can graph by one metric, compare one metric to another (e.g. visitors versus average time on site), or compare a metric to your site average. Once you graph your selected metrics, you can roll your mouse over the graph to see the actual values of the two metrics you're comparing.

For example, let's say your site saw a sudden surge in traffic from an search engine optimization effort. You can use the 'Graph mode' option to graph 'visits' and '% new visitors' on the same graph. This will show you whether the SEO campaign successfully reached new visitors or whether it was more successful in driving repeat visits.


To use graph mode, click the pulldown menu in the top left of the graph of a selected report. Then, select the graph view you'd like to see. To finish, click the pulldown menu tab one more time.


Friday 15 May 2009

Let’s face it: Social media is here to stay, and day by day it continues to encroach on nearly every aspect of our online lives. But to publishers, promoters, advertisers and site owners, there’s one essential question left hanging in the air long after the race to join the social media crowd: “Is it working?”

This year’s Lollapalooza Music Festival is using Event Tracking and Google Analytics to find out.

Social Media Applications

There may not be a more perfect application of social media than promoting a music festival, and C3 Presents, (the folks behind Lollapalooza) came up with some good ways to capitalize. This year’s lineup page alone features a Facebook Connect application to maintain and share personal lineups, MySpace blog, bulletin and site postings, Twitter updates and email sharing, and AddThis social bookmarking.
“You don’t find anyone who thinks social media is a bad idea, but the questions on our minds are, ‘what is this doing for our fans and what kind of return are we getting back on this investment?’” says Michael Feferman of C3 Presents.

Questions to Answer

As with any successful web analytics strategy, this one started out by posing the questions that Google Analytics should answer. Specifically:
  • Who’s using these sharing and social media outlets? Are they benefiting?
  • Which ones are being used the most and what are their applications?
  • Does social media make a visitor more likely to buy a ticket?
  • Are we driving more traffic to our site as a result? Are we driving more sales and revenue?
WebShare, a Google Analytics Authorized Consultant, was brought in to help implement and configure Google Analytics to help answer these questions. Measuring the impact of social media for Lollapalooza has two sides:
  • The impact on those who use social media applications while on the site
  • The impact of those who arrive at the site as a result of social media
The Implementation

Event Tracking and Campaign Tagging were employed in order to provide the data required to answer these questions.

Event Tracking

While a user is on the site, events “fire” as the visitor interacts with the various social media applications. Lollapalooza tracks when sharing applications are clicked, when users log into Facebook accounts via Facebook Connect and perform various actions, and when visitors register or log into their Lollapalooza accounts.


*Actual values have been modified

Drilling down into the event categories, actions and labels reveals even more about user behavior, and coupled with the secondary dimensions and pivot tables that were recently announced, we can answer some very detailed questions, like:

How much revenue and how many transactions resulted from visitors in Chicago that used Facebook Connect and found the site via the keyword “lollapalooza 2009”?

*Actual values have been modified

Campaign Tagging

In order to track visitors arriving at the site as a result of social media, links that are generated and shared are tagged with unique values to define campaign parameters. The reports and segmentation options of Analytics then help us understand these visitors and their value in terms of Goal and Ecommerce conversions.

When visitors share via Twitter, for example, a pre-populated message with a bit.ly compressed link is used that includes Google Analytics campaign tag parameters:


When followers of this user click on the link, Google Analytics attributes the visit to a source of “twitter” and a medium of “share”. This data is then available in our reports, and we can answer questions like:

What kind of revenue and ticket sales resulted from Twitter sharing yesterday?

*Actual values have been modified

The Results

The data continues to roll in, but some impressive insights have been gained so far:
  • Over 2/3 of the traffic referred from Facebook, MySpace and Twitter is a result of sharing applications and Lollapalooza’s messaging to its fans on those platforms.
  • Users of the social media applications on Lollapalooza.com spend twice as much as users that don’t.
  • “Fan Engagement” metrics such as time on site, bounce rate, page views per visit and interaction have seen significant boosts across the board as a result of social media applications.
More details and findings are available on C3's digital marketing blog.

“This kind of data is fantastic,” says Michael. “Not only does it help us give our fans what they want, it let’s us know how they respond to it and tells us that these efforts are worth it.”

Other Resources

To learn more about the reports, configurations and features highlighted in this post, take a look at the following resources:
Posted by David Booth of WebShare, a Google Analytics Authorized Consultant

Thursday 14 May 2009

For approximately one hour today starting at 7:48 am Pacific Time, Google had an error in routing traffic that prevented Google Analytics from collecting a small amount of data for some web properties.

On average, this will appear as roughly a 1% decrease in traffic for Thursday, May 14. The exact amount may be more or less depending on the concentration of traffic your site experienced during this one hour time period.

On behalf of our team, we're very sorry for the inconvenience this error has caused. For additional information on the error, see the Official Google Blog.

Tuesday 12 May 2009

Last week we announced some new features in Analytics including pivoting, secondary dimensions and the option to share customizations (like Advanced Segments). These features will be rolling out to everyone over the next few weeks. In anticipation of the release, we'd like to announce a contest for the coolest, most useful Advanced Segments. For example, one of the engineers from Google's mobile team created a segment for iPhone users that's now available to everyone.


The winning segment should be applicable to a wide audience and have a clear use case. If you can explain how you've used the segment to increase your website ROI, that's even better.

The winner will receive a Google Analytics teeshirt, stickers, a GAIQ voucher and a shower of praise on the blog. We'll even email your boss to tell him or her about your Google Analytics mastery. Once the new features launch for everyone, we'll follow up with a request for URLs, so get your segments ready today!

Check out this post for more information on how to configure Advanced Segments.

Monday 11 May 2009

Usually reports are mailed out to marketing managers or directors to measure any change in progress from week-to-week. With Google Analytics, you can make the process completely automated -- you can schedule your reports to be emailed daily, weekly, monthly, or quarterly. To start emailing your reports in PDF, CSV, XML, and TSV format, just click the 'Email' icon above all your reports:

This Help Center article has comprehensive instructions on how to schedule your reports or email them on the fly.

If after scheduling reports you want to delete them, you can do so at any time by going to the 'Manage Scheduled Emails' dashboard. This may be a little hard to find since you have to click a separate 'Email' icon in the reports page.

To delete a scheduled email, please follow these steps:

1. Find the other 'Email' icon on the left hand side of the reports page. Look at the image below to get an idea of where it's located.


2. After clicking the icon, you should see a list of scheduled reports. Click the icon that looks like a trash can in the upper right hand corner to delete them forever.


Hopefully after reading this post, you've automated sending out reports and have one less thing to worry about on Mondays!

Thursday 7 May 2009

Last year, Justin Cutroni of EpikOne published a four-part tutorial on how to use Ecommerce Tracking in Google Analytics. We've seen a lot of interest in this topic, so we thought we'd republish the first part of the series here on the Analytics blog.


Ecommerce Tracking Part 1: How it Works

This post is the first in a series of e-commerce transaction tracking with Google Analytics. Why is e-commerce tracking important? Well, transaction data is a vital piece of information when analyzing online business performance.

Sure, it’s great to measure things like conversion rate, but revenue is much more tangible to many business owners. Having the e-commerce data in your web analytics application makes it easier to perform analysis. Do you need to set up e-commerce tracking? No, but it sure helps. :)

The Big Pictures

E-commerce tracking is based on the same principal as standard pageview tracking. JavaScript code sends the data to a Google Analytic servers by requesting an invisible gif file. The big difference is that e-commerce data is sent rather than pageview data.

But how does Google Analytics get the e-commerce data? That’s the tricky part. You, the site owner, must create some type of code that inserts the transaction data into the GA JavaScript. Sounds tricky, huh? Well, its not that bad.

Step by Step: How it Works

Let’s break it down and walk through what actually happens.

  1. The visitor submits their transaction to your server.
  2. Your server receives the transaction data and processes the transaction. This may include a number of steps at the server level, such as sending a confirmation email, checking a credit card number, etc.
  3. After processing the transaction the server prepares to send the receipt page back to the visitor. While preparing the receipt page your server must extract some the transaction data and insert it into the Google Analytics JavaScript. This is the code that you must create.
  4. The receipt page is sent to the visitor’s browser.
  5. While the receipt page renders in the visitor’s browser the e-commerce data is sent to Google Analytics via special GA JavaScript.
  6. Here’s a basic diagram of the process. Again, the biggest challenge during implementation is adding code to your web server that inserts the transaction data, in the appropriate format, into the receipt page. I’ll cover the setup in part 2 of this series.


What Data can be Tracked?

Google Analytics collect two types of e-commerce data: transaction data and item data. Transaction data describes the overall transaction (transaction ID, total sale, tax, shipping, etc.) while item data describes the items purchased in the transaction (sku, description, category, etc.). All of this data eventually ends up in GA reports. Here’s a complete list of the data:

Transaction Data

  • Transaction ID: your internal transaction ID [required]
  • Affiliate or store name
  • Total
  • Tax
  • Shipping
  • City
  • State or region
  • Country

Item Data

  • Transaction ID: same as in transaction data [required]
  • SKU
  • Product name
  • Product category or product variation
  • Unit price [required]
  • Quantity [required]

A few notes about the data. First, the geo-location data is no longer used by Google Analytics. The new version of GA tries to identify where the buyer is located using an IP address lookup.

Also, you should avoid using any non-alpha numeric characters in the data. Especially in the numeric fields. Do not add a currency identifier (i.e. dollar sign) in the total, tax or shipping fields. this can cause problems with the data.

Continue reading parts 2-4 of this series on EpikOne's Blog, Analytics Talk

Posted by Sebastian Tonkin, Google Analytics

Wednesday 6 May 2009

Today at eMmetrics San Jose, we announced four feature updates coming soon to Google Analytics. These features are especially relevant if you're an Advanced user of Google Analytics.

Pivoting and Secondary Dimensions

Pivoting and Secondary Dimensions are new features available in most table views that allow inline cross-tabular analysis of data. You can use these new power features to do in-depth, on-the-fly analysis and see all the information in the same table. View data by two dimensions at once, such as keywords and cities. Next, pivot by another dimension such as source, while also viewing two additional metrics such as visits and pages/visit.... all within a single table view.

The possibilities are virtually endless and potentially mind boggling (you've been warned!). Watch the video below.


Share Custom Reports and Advanced Segment Customizations

Also announced today is the ability to share customizations you have made to Custom Reports and Advanced Segmentation by simply sharing a URL. Think you have the ultimate custom SEO report? Post the URL for the report to your blog or email it to a friend. When people click on it, they import the report structure, so rather than seeing your data, they see the report you built, but with their data in it. Now people can share their more interesting Google Analytics customizations without having to send detailed instructions, just share a URL!


Manage Customizations Across Profiles

In addition, if you have multiple profiles you will be able to pick and choose which ones get which Custom Reports and Advanced Segments associated with your account. So if you import or create the ultimate Search Engine Marketing report and one of your profiles doesn't do SEM, simply don't add it to that profile.

All of these new features are in beta and will first be available to show attendees, then will begin rolling out in everyone's reports over the coming weeks.

Tuesday 5 May 2009

We know that web publishers can get frustrated when public estimates of their traffic don't match what they're seeing in their web analytics accounts. Publishers with ad revenue at stake need to present the best possible data to advertisers, but they couldn't do much about it... until now.

Today, we are announcing an integration with Google Ad Planner Publisher Center that allows you to opt in some of your Google Analytics data into Google Ad Planner so that you can replace traffic estimates with directly measured Google Analytics data. Of course, this feature is strictly optional and provides the most value to publishers who have ads on their site. A lot of publishers have requested this feature and we hope that those of you who do enable the feature will enjoy seeing data that matches what you see in Google Analytics.


To see how your site is currently displayed in Google Ad Planner, visit the Google Ad Planner Publisher Center and search for your site. If you want to get started managing your site profile in Google Ad Planner and opt in your Google Analytics traffic metrics, first enable the "Share my Google Analytics data with Google products only" from within your Google Analytics data sharing settings page. Then, go to your Google Ad Planner account, sign in, and select the Google Analytics metrics you'd like to share publicly. Once you do, your Google Analytics traffic metrics will replace Google Ad Planner's estimates of your traffic, and potential advertisers can see the important metrics that you are seeing.*

For more information about the Google Ad Planner Publisher Center, visit the Ad Planner Help Center, or watch our video below:


*Please note that publishers who decide to share their Analytics data for the first time may have to wait up to 48 hours to see the traffic data in their Ad Planner account.

Monday 4 May 2009

Your site may be getting a lot of traffic from referring sites, but which websites refer visitors that actually convert to a goal? There’s a basic report that can show you where your quality traffic is coming from: the Traffic Sources report.

To spot which website links are referring visitors that convert to your goals, follow these steps:

1. On the main ‘View Reports’ screen, choose
Traffic Sources in the lefthand navigation.

2. In the same area you'll now see a list of subset of reports. Click on 'Referring Sites.'

3. Now you'll see a report of all the top sites that refer traffic to you ("referral" = the user clicked a link on the
sourcesite). Click on the Goal Conversion tab.

4. Now you'll see the top 10 referral domains. In the bottom gray section, choose a larger number for 'show rows' in order to see them all.

5. You'll get a breakdown of goal conversion percentages for every referral. Right above the data table, you'll see a score card listing your site average's data so that you can compare it to the information coming from specific sources.

Of course, for this report to actually show goal conversion data, you’ll need to have created goals for your website. You can either read a quick how-to from our Help Center, watch a video, or view a GA IQ learning module on it.

If you run an ecommerce site and would like some more information on identifying valuable referrers, you may want to check out this post written by one of our Authorized Consultants.


Friday 1 May 2009

Its been a week since we launched the Google Analytics Data Export API and we're already seeing Google Analytics being used in exciting new ways. For example, Michael L. of the New York Public Library is visualizing search data as tag clouds, and Patrick C. is using the Google Analytics API in conjunction with technical software to generate plots of online buzz and graphs of site traffic flows.

Sometimes it's easier getting started using the tools you're most familiar with. While we initially released Java and JavaScript client libraries, a number of talented 3rd party developers have created 9 new Google Analytics Export API client libraries in PHP, .NET, Python and Ruby. All of these libraries have been released as opensource and are supported by the developers themselves. We're very excited to see developers building on top of our API and giving back to the community.

In addition to these libraries, we've added new JavaScript interactive samples to play with the API in real time. These fully interactive examples allow you to see how the API gets data, visualize the data returned, review the code and even edit the functionality directly in the browser (You need a Google Analytics account to make this work).

If you haven't done so already already, come share your new apps, tutorials, and best practices in the Google Analytics API discussion group.

We look forward to hearing from you!

Google Analytics API Team