Thursday, 30 April 2009

That's right, we're going to be in Australia, Canada and of course the USA...

Seminars for Success are day-long seminars designed to help you improve your online marketing and get the most out of Google Analytics and Google Website Optimizer. We've selected industry professionals from our Google Analytics Authorized Consultant network to teach these seminars in cities around the U.S.

Google Analytics – Introduction & User Training

Thursday, May 14 - Melbourne, Australia
Tuesday, May 26 - Toronto, Canada
Wednesday, May 27 - Phoenix, AZ

Walk away from day one with the knowledge to take actionable information out of Google Analytics and drive your business decisions. Day one topics include:

  • Introduction to Web Analytics
  • Common Interface Features
  • Dashboard Reports & Customization
  • Understanding Visitors
  • Much, Much More…

Google Analytics – Advanced Technical Implementation

Friday, May 15 - Melbourne, Australia
Wednesday, May 27 - Toronto, Canada
Thursday, May 28 - Phoenix, AZ

Day two takes you through Google Analytics configurations, best practices, filter set ups and advanced installs and implementations. Day two topics include:

  • Profiles and Strategies
  • Filters – Uses and Implementation
  • Profile and Filter Combinations
  • Goals & Funnels - Configuration & Setup
  • And much, much more…

Landing Page Testing with Google Website Optimizer

Friday, May 29 - Phoenix, AZ

The Google Website Optimizer experts present this practical course taking you through the process of testing your site to improving your users’ experience and seeing your conversion rates soar. The course includes an overview of Website Optimizer, loads of testing best practices, and hands-on experience to better understand and run A/B and multivariate tests on your website and key landing pages.

Seats are limited, so register today!

Wednesday, 29 April 2009

For the past few months, more and more Analytics users have been invited to integrate their Analytics and AdSense accounts. Today that feature has become available to everyone. That means if you have an AdSense account, it's time to get it linked! Here's how:

Linking your Analytics and AdSense Accounts
  1. Log in to AdSense
  2. Click the link that says "Integrate your AdSense account with Google Analytics" on the Reports > Overview tab
  3. Follow the on-screen instructions


Having trouble? Visit this help center article.


Which Reports are Available


Once you link your accounts, you'll find an AdSense-specific menu under the "Content" section of Analytics containing these reports:
  • The Top AdSense Content report allows you to see more details about specific pages on your site and analyze ad performance. For instance, if you find that some of your pages generate a high number of pageviews but aren't monetizing as well as other pages, you can focus your optimization efforts on improving these pages.
  • The Top AdSense Referrers report can help you see how different incoming traffic sources contribute to your revenue.
  • Last, the AdSense Trending report lets you analyze how your site generates revenue during different times of the day and different days of the week.


How to Read the Reports


Check out this video to get a better understanding of how to use these reports:


You'll also notice that other sections of your Analytics account will show a new "AdSense Revenue" tab. You'll be able to compare how much of your AdSense revenue is coming from new visitors versus existing ones, and view revenue based on user language.

Enjoy your new data, and be sure to visit the Help Center if you have other questions about linking your accounts or reviewing your reports.

Like the new feature? Hate it? Leave a comment and let us know!

Tuesday, 28 April 2009

Just as having the right web analytics data is critical to making smart marketing decisions, having the right set of tools is equally imperative when it comes to testing & tuning your Google Analytics implementation. Read on to discover the tools used by one Analytics Pro in troubleshooting and solving Google Analytics problems every day.

Why you need tools and what you can use them for


Implementing Google Analytics can be easy - just copy and paste the script produced during the account or profile creation process, right? Yes, and no. For more complex websites, it's a good idea to take some extra steps yourself, or hire someone, to validate your installation and make sure everything's working as it should.

When problems arise they are usually easy to spot within Google Analytics reports. Odd data such as a high degree of "self-referrals" (visits being reported as "referred" from your own domain name), a strangely high rate of conversions for an unexpected traffic source or medium, or an amazingly low bounce rate (3.8% bounce rate isn't really good, it's broken) are signs something may be wrong.

Enter the toolbox! In it you'll find an array resources for quickly identifying the root causes of Google Analytics anomalies - those most commonly being
  • JavaScript errors,
  • cookie problems, or
  • client-side page load time issues (not to be confused with slow connections... this is different).

Tools every Google Analytics professional should have


1) The Browser to Start with: Firefox

The Firefox browser is probably the most important tool for technical debugging work with Google Analytics. The browser itself isn't what matters so much as the myriads of add-ons that are available for it. To get started on building your toolbox, get Firefox if you don't have it already (and don't worry, there are some tools for Internet Explorer too!).


2) Working with JavaScript: Firebug for Firefox

This is where the march of add-ons for Firefox begins. The first and probably most important tool in the box is Firebug, an add-on for Firefox. Use the following Firebug features when debugging Google Analytics implementations:
  • Detecting JavaScript errors quickly and easily - identify the script and line of code within the script that is the culprit
  • Testing JavaScript code within the browser environment without having to edit an actual page on the server using the script console window in Firebug


Firebug can do much more than just detect script errors and help you rapidly test JavaScript, but these applications are particularly useful for Google Analytics technical work, especially when used in conjunction with additional tools detailed below.


3) Working with Cookies: Web Developer Toolbar in Firefox

The Web Developer Toolbar is most useful for Cookie analysis and diagnosis when working with Google Analytics. It is much faster to use when needing to view just what cookies have are currently set for a given page you are viewing. You can easily see key information for each cookie, find the "utm" cookies, and view details such as the domain the cookies were written for and what the values are.


4) Tracking the Data Stream: Live HTTP headers

Debugging JavaScript and cookies is where troubleshooting begins. Once you are confident the scripts are working properly and cookies are appropriately set, the reporting mechanism for Google Analytics, the utm.gif tracking hit, must still take place in order for data to be reported into your Google Analytics account. Live HTTP headers is a tool of choice for identifying when these utm.gif tracking hits take place.

Bonus configuration option for Live Headers: under the "config" tab enter ".*__utm\.gif.*" (without the quotes) into the "Filter URLs with regexp" field, and make sure the field is checked. This will limit the Live Headers window to only show utm.gif hits, otherwise finding one or two utm.gif hits amidst all the other requests that will fly by may feel like the proverbial search for a needle in the haystack


5) Page Execution Speed: Chrome JavaScript Console

The JavaScript Console in Google's new Chrome Browser is perfect for detecting potential issues on sites that have a lot of other JavaScript running or have the Google Analytics tags placed on the page in a manner that other elements may slow down the code from running. The JavaScript console "resources" pane shows the number of seconds it takes for the Google Analytics script to be loaded and the utm.gif tracking hit to run.Consider this example: it took 6.58 seconds from when the browser began loading this page to when the ga.js file was loaded - and it took even more time before the utm.gif hit was fired! How many people leave before 6.58+ seconds? We will never know because of a latency issue on this page.

Tip: using this tool, if you detect a latency problem, consider optimizing the other JavaScript running on your site, optimizing image files, or placing the Google Analytics code higher in the page so that it does not have to wait for everything else to complete before it runs (note that placing the code in the of the page can bring some additional dependencies with it, so consider seeking the counsel of an experienced Google Analytics professional if considering this change).


Tools for Internet Explorer

While many will argue that Firefox or Chrome is a "better browser," we must face the reality that, for now at least, Internet Explorer sill leads the global market in browser use. Thus, if you do all your debugging in Firefox or Chrome, you may easily miss problems that would arise for Internet Explorer users. Or perhaps you're already aware of such problems and need to diagnose them further. Here are a few tools that are available for IE.


6) JavaScript Debugging in Internet Explorer: DebugBar

DebugBar is sort of like an Internet Explorer hybrid incarnation of the Web Developer Toolbar and Firebug add-ons for Firefox. Using this tool you can track down JavaScript errors in Internet Explorer in the same way Firebug works, plus some advantages. You really have to check it out to get a feel for all the features. Bottom-line: use this tool for analysis of JavaScript errors you suspect are holding up accurate Google Analytics reporting.


7) Live Data Stream Analysis in Internet Explorer: Fiddler2

Fiddler is like Live HTTP Headers, except that it is a standalone application that can detect HTTP traffic between any application your computer and outside web servers. This makes it more accurate than Live Headers in Firefox. It can be used with Internet Explorer, but also other browsers, including Firefox. The tools for analyzing captured requests, utm.gif hits included, are superior to Live HTTP Headers in many ways.


8) Cookies in Internet Explorer: IE Cookies Viewer

This small but powerful tool lets you easily find, view, and even modify cookies for Internet Explorer. It is indispensable for Google Analytics diagnostic and troubleshooting work when encountering cookie domain issues.


In Conclusion

So, there you have it: a plethora of tools that are tried and true means to the trouble-free Google Analytics end you're seeking. Here's a recap shortlist of the tools:
Posted by Caleb Whitmore of Analytics Pros, a Google Analytics Authorized Consultant

Monday, 27 April 2009


The Motion Charts feature seems like an advanced tool, but it's actually designed for Analytics users at all levels. It's useful for spotting trends and relationships amongst individual variables when your visits may look flat as an aggregated set of data. Today, we'll illustrate how Motion Charts can graph and compare several keywords over time.

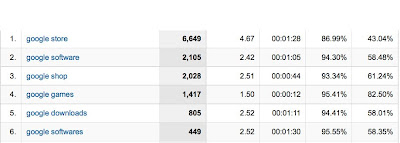
For example, let's say you want to graph traffic over time for each of the top keywords in the report below. You can easily do so by going to the Keywords report under the 'Traffic Sources' section.

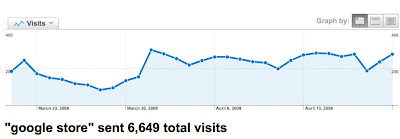
Of course, you can click each keyword to see a graph over time, but this doesn't allow you to make comparisons.


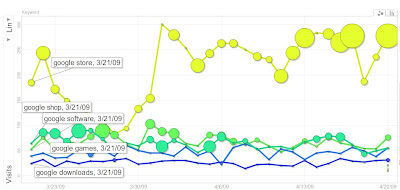
However, Motion Charts allow you to graph and compare individual keyword performance over time. To access Motion Charts click the "Visualize" button at the top of most reports, such as the "Keyword" report located under "Traffic Sources."


You can now see that, except for a dip in traffic between Mar 23 and Mar 30, "google store" sent more traffic every day than the other keywords. "google downloads" sent the least amount traffic each day.

But this graph also provides a bonus. If you set the size of the dots to represent revenue, you can identify the days during which traffic actually paid off in revenue. For example, "google store" doesn't generate revenue every day (even when it sends lots of traffic). "google shop" and "google software" frequently generate revenue, but not as much as "google store".

Generating this graph is easy. Just follow these steps:

  1. Go the Keywords report (or any other report with table data) and click 'Visualize.'
  2. Select "Time" for the X-axis and "Visits" on the Y-axis. For Size, select "Revenue" (or any other metric you want to track).
  3. Now, select the keywords you want to graph (use the 'Select' box below the 'Size' menu) and select Trails. Press 'Play' or drag the slider across to the end of the time period.

After following these steps, a graph like the image above should appear. If you've selected a lot of keywords, your labels may bunch together, but you can drag and reposition the labels to see parts of the graph that are obscured.

Of course, you can use this technique on any report which has a 'Visualize' button. If you discover a new use for this technique, please post a comment and share your best practice with us.

Thursday, 23 April 2009

Are you segmenting your data or just looking at aggregated numbers (like total visits)? If you're not segmenting, you're barely scratching the surface of what you can do with Analytics data. This is a favorite topic of Avinash Kaushik, Google's Analytics Evangelist, who has been encouraging segmentation since way back in 2006.


In a recent talk at a Google Analytics Masterclass in Singapore, Barbara Pezzi of Swissotel shared her company's experience using Advanced Segmentation to zero in on high-potential customers.

You can find the full story and presentation on the new Google Solutions for Southeast Asia blog. Check it out and get started segmenting your data today!

Tuesday, 21 April 2009

A Google Analytics API has long been one of our most widely anticipated features. Today we're pleased to announce that the Google Analytics Data Export API beta is now publicly available to all Analytics users!

What's so exciting about an API? The API will allow developers to extend Google Analytics in new and creative ways that benefit developers, organizations and end users. Large organizations and agencies now have a standardized platform for integrating Analytics data with their own business data. Developers can integrate Google Analytics into their existing products and create standalone applications that they sell. Users could see snapshots of their Analytics data in developer created dashboards and gadgets. Individuals and business owners will have opportunities to access their Google Analytics information in a variety of new ways.

For example, how would you like to access Google Analytics from your phone? Now you can, with this Android application from Actual Metrics. How about accessing Analytics from your desktop? It's here from Desktop-Reporting.  

And if you're interested in seeing how integrating Google Analytics can enhance your own business take a look at these examples. MailChimp has integrated Google Analytics into their email marketing  platform and ShufflePoint® provides a service for adding Google Analytics data into PowerPoint® presentations. See how youcalc has created apps that allow you to mashup Google Analytics, AdWords, Salesforce.com and other enterprise data. 

Check out more customer examples on our developer site. These apps demonstrate only some of the creative possibilities and we know you'll discover other interesting ways to use the Analytics API.  

So, how does the API work?  

The Data Export API is easy to use and provides read-only access to all your Analytics data.  Any data that's available through the standard Analytics web interface is available through the API. The Analytics API is a Google Data API. This is the same API protocol for Google Calendar, Finance and Webmaster Tools.  If you've used any of these APIs, the Google Analytics Data Export API will look very familiar to you. 

For the JavaScript and Java programming languages, we've provided client libraries to abstract and simplify the process. We're also working on supporting more programming languages. In the meantime, for any programming language you want to use you can make requests directly to the API over HTTP and access the data in XML.  

How do I get started? 

There are three key resources you'll want to use when you start developing on top of the Google Analytics API.  First, all the documentation you need can be found on our Developer site at Google Code. Here you'll find example code, a developer guide, FAQ, and the complete API reference. 

Second, be sure to sign up for the Google Analytics API Notify email group so you get the key announcements on feature updates, code changes and other service related news that relate to the API. (Don't worry, this will be a low-traffic email list and we promise to only send emails when there is something important that affects developers.)  

Finally, you'll want to become a part of the Google Analytics developer community by joining the Google Analytics APIs Group. This user forum is a great way to share ideas and get feedback from other developers. We also check in on these forums so let us know what you think about the API there, and share your ideas and your applications with us. We look forward to seeing your creativity!

Posted by Nick Mihailovski and the Google Analytics API Team 

Monday, 20 April 2009

One of the many ways Google Analytics keeps its reports dynamic with interesting data is to add buttons and other interactive features for you to analyze your reports with. Almost every report has over ten clickable features for you to jigger with, so this can get overwhelming for beginners -- especially if they've always seen their reports as flat pie charts or data tables.

Below are a few examples of how you can use these features and implement them as a part of your report analysis routine.


1. The 'Graph by' button

Beneath the date range selector for your graphs, there is a 'Graph by' feature that lets you graph your data by day, week, or month so you can analyze trends according to the selected view. Some Visits reports have an additional hourly view you can graph by if you really need that extra granular level of data. Get more details about each graph view here.

2. 'Views' button

The 'Views' buttons underneath the graph gives you the option to view your top content data by a variety of criteria - either by data table, pie chart, bar graph, or comparison view.


For the Top Content report, the 'Comparison' view is very useful to spot which pages outperform or underperform the site average. In the Comparison view shown above, we've sorted the pages based on the number of pageviews they each received and are comparing the bounce rate for each page to the site average. We can instantly see that the page that received the most page views also underperformed the site average in terms of bounce rate. But the second and third pages out performed the site average bounce rate.

Read some tips about keeping your visitors on your site and improving your site's conversion health.


3. Dimension segmenting pull-down menu

The 'Dimension' pull-down menu lets you segment one report within Google Analytics by one variable, giving you further context about your visitors. For the content detail reports, you can see how people came to a particular page by changing the dimension to 'Source,' or see what kind of traffic has been referring people by clicking 'Medium.'

If your site is seen in multiple languages, try selecting 'languages' for the dimension. Once you see an unusual spike in visits for a particular language or country, try modifying your site to serve your customers (i.e. translating certain pages or adding country-specific products) and see if your conversions grow, like this guy's. You never know if Mexicana music is enjoying a new revival in Venezuela!

4. Graph mode option

Visualize and compare two metrics at a time for a selected report by selecting from the 'Graph mode' pull-down menu in your reports. Comparing two metrics can show trends you may not have been able to spot solely from within your data table. Although there isn't much actionable insight this feature may give you, you can use it to raise some educated guesses about your traffic patterns and test them out.

To learn how to use the multi-line graphing feature, please read this article.


Hopefully this post has you starting out your week by pressing all the right buttons in your reports!

Wednesday, 15 April 2009

A brief update to yesterday's post about Google.com search referrals. We initially reported that Urchin Software might require a patch to handle the new URL structure, but after some additional testing, it turns out no patch is needed. Urchin can handle both the current and new URLs. The latest release (Urchin 6.5) has a bunch of new features, including the ability to tap into the AdWords API, so we suggest everyone upgrade regardless!

Tuesday, 14 April 2009

First, just a heads-up that if you don't analyze your own traffic logs, use Urchin web analytics software, or develop web analytics software, you probably don't need to read this post. We're writing this for the most geeky among us, because Google Analytics will not be affected by this information. On the other hand, we do want to let you know about some changes to Google search that are coming down the pike, before you start seeing (potentially) alarming headlines.

Starting this week, you may start seeing a new referring URL format for visitors coming from Google search result pages. Up to now, the usual referrer for clicks on search results for the term "flowers", for example, would be something like this:

http://www.google.com/search?hl=en&q=flowers&btnG=Google+Search

Now you will start seeing some referrer strings that look like this:

http://www.google.com/url?sa=t&source=web&ct=res&cd=7&url=http%3A%2F%2Fwww.example.com%2Fmypage.htm&ei=0SjdSa-1N5O8M_qW8dQN&rct=j&q=flowers&usg=AFQjCNHJXSUh7Vw7oubPaO3tZOzz-F-u_w&sig2=X8uCFh6IoPtnwmvGMULQfw

The key difference between these two urls is that instead of "/search?" the URL contains a "/url?". If you run your own analyses, be sure that you do not depend on the "/search?" portion of the URL to determine if a visit started with an organic search click. Google Analytics does not depend on the "/search?" string in the referrer, so users of Google Analytics will not notice a difference in their reports, but other analytics packages may need to adapt to this change in our referrer string to maintain accurate reports.

The new referrer URLs will initially only occur in a small percentage of searches. You should expect to see old and new forms of the URLs as this change gradually rolls out.

If you are using UTM-based tracking with Urchin Software, you'll want to stay tuned for a software update that we'll be making available soon. If you are using IP-Useragent based tracking with Urchin, you won't be affected since this form of tracking can successfully process both current and new referral strings.

The Google Analytics Site Search feature is a powerful tool for analyzing visitor interest and behavior on your website, but that's not all it is good for. Using Site Search in some creative ways can leverage this tool for advanced multi-dimensional analysis equivalent to being able to set multiple, simultaneous user-defined segments.

What is Site Search in Google Analytics?

The Site Search reports in Google Analytics are designed to provide a means to analyze how visitors search the content on your site if you have a site search tool, whether it be one from Google itself such as Google Site Search or a Google Mini Search Appliance, a site search tool built into your website's Content Management System, or of of the myriads of other site-search tools available today.


These reports compile information about how many of your visitors use site search, what they search for, what page they start searching from, what pages they click to after searching, and more. Moreover, the reports can track as many searches per visit as are conducted. As with most other dimensions in Google Analytics, site search dimensions can be used in Advanced Segments and Custom reports to create an extremely powerful analysis engine.

How does Site Search work?

Site Search in Google Analytics is based on identifying pre-defined query values and category identifiers from the Request URI. The parameters can be anything - simply define them in the appropriate field in the profile configuration screen within your Google Analytics account. In the screenshot below you can see that Site Search has been enabled and is looking for several potential query parameters and category identifiers.


Thus, if Google Analytics received a pageview to a Request URI of "www.analyticspros.com/results.html?q=email+tracking&category=support" and the settings above were active for the profile, the Site Search reports would record the following:
  1. A visit used site search
  2. The search term "email tracking" was used once
  3. This search was conducted in the "support" category


Another key feature about Site Search is the "search term refinement" report. This report shows a drill-down of searches performed after the term in question was searched. This is an incredibly important feature because it allows analysis of progression and relationship from one independent variable (search term) to another.


Looks like someone was a bit hungry when thinking about email marketing...

Where the "creative" uses begin

This is where the fun really gets started. Since Site Search is based on contents of a reported Request URI, we can pass anything we want into the Site Search reports. Consider what we already know about how Site Search works:
  • Site Search has two independent dimensions: category and keyword or term
  • If multiple searches are performed during the same visit they will all be recorded under the Search Terms report and can be related by way of the Refinements report
  • Any Request URI that contains a query string matching the defined parameters for search term and category will trigger a "site search" to be recorded
Thus, if we setup Site Search to capture meaningful data via the Request URI that wasn't site search but was still useful and relevant to analysis, the possibilities are endless!

Creative use in action: unlimited User-Defined segments

If you've been using Google Analytics for a while you may well have run into the fact that, currently, only one user-defined segmentation cookie value can be set at any given time. There are plenty of "alternative methods" to try and work around this reality one way or another. And note: this should not be confused with the recently released Advanced Custom Segments tool which is extremely powerful and can be used to create any number of custom segments. The user-defined and advanced segments features work as they are designed: however this method provides an additional way by which you can further extend your use of Google Analytics.

The Scenario

Let's say that you want to classify your visits by expressed industry and product interest based on the input of a form. Using standard user-defined segmentation would not work for this as it would only support industry or product interest. However with creative Site Search analysis, an unlimited number of "industry" and "product" interests can both be tracked for each session. A practical use of this would be tracking responses on a lead generation or sign-up form that had check boxes or select options for "Industry" and "Product".

How to make it happen:
  1. In the example above (tracking fields in a form to create Site Search segments) you'll need to generate a virtual pageview with a defined Request URI syntax. For this example use:

    pageTracker._trackPageview('/custom/lead-form/segment.html?segcat=[segment type]&segterm=[segment value]')

    Where "segcat" is the identifier for a Site Search "category", "segterm" is the identifier for the Site Search "term", "[segment type] is either "industry" or "product", and "[segment value]" changes depending on the form field value.

  2. For each industry and product field option on the form, create an "onclick" element that calls the pageTracker script with the corresponding values for "segment type" and "segment value" defined for that field.

  3. The result will be a "pageview" hit each time a visitor selects a form option. Let's say you have 5 industries available and 10 products of potential interest, the resulting data would show which industries are most commonly selected and in what order, as well as which products are most desired, and how the products relate to each other via the Refinements report.

Why not use use Event Tracking for this?

It's a worthwhile question and has some merit, however at the time of this writing, you still need to request access to the Event Tracking beta before you can use it. Furthermore, Event Tracking can't be used in Advanced Custom Segments or Custom reports at the time of writing, nor does it have the Refinements analysis options and the "start pages" and "exit pages" reporting.


What are other creative uses for Site Search?

The example here is just one way in which Site Search can be used for more than, well, site search analysis. For example, a few additional uses include:
  • Tracking Rich Internet Applications (RIA's) using this Site Search method rather than Event Tracking can provide some advantages,
  • Tracking store product interest when the Category and Product name are persistently available in the URI or a Virtual Pageview can reveal new product interest trends for online retailers,
  • And using Site Search in creative ways to measure Internal Ads and Cross-promotions will clear the mist on what promotions really drive sales on your site.

In Closing

Like many things, using something in a way other than what it was designed for can be a dangerous activity, but fortunately for us Web Analysts this method of creatively extending Site Search has a lot of upside and little downside. So, go out and give it a shot. It is highly advisable to experiment in a non-production environment first, and even in a live environment, use multiple trackers - one for normal pageviews and one for normal pageviews + site search segmentation pageviews.

And, to give credit where credit is due: props to Justin Cutroni from EpikOne for mentioning this concept to me when Site Search was first released, and Mike Plummer from POP for expanding the technique as a method for event and interaction tracking.

Posted by Caleb Whitmore of Analytics Pros, a Google Analytics Authorized Consultant.

Friday, 10 April 2009

There has been some chatter bouncing around the blogosphere and twittersphere that we are deprecating urchin.js sometime this summer. This is not accurate. To be clear: we have no immediate plans to decommission urchin.js. If and when we do, we will make sure users get clear, advanced notification from us and time to switch.

Now for the more nuanced story:
For about a year now, all new accounts have been set up using ga.js instead of urchin.js. Here some of the benefits to using ga.js:
  • Faster, smaller source file
  • Automatic detection of HTTPS
  • Increased namespace safety
  • More convenient set up for tracking e-commerce transactions
  • More customizable code for interactive Ajax-based sites
  • Ability to take advantage of the most up-to-date tracking functionality as it is added to Google Analytics
Generally speaking, there are good reasons to make the switch and we certainly encourage people to do so. However, there is no immediate need or requirement to do so. Make the switch to ga.js when it is convenient for you or when you are ready to start taking advantage of the improved functionality.

Wednesday, 8 April 2009

We promised Hawaii when we first launch and now we can deliver! If that doesn't work, we will delivering seminars in Orange County and Boston! That's 3 cities to choose from in April.

It's your choice.. Pacific sun and surf in Orange County or Honolulu, flowers blooming in Boston. These seminars are brought to you by our Google Analytics and Google Website Optimizer experts.

Learn how to truly leverage the power of Google Analytics and Google Website Optimizer through Seminars for Success this spring in Orange County and Honolulu. These full day, interactive seminars are led in person by the experts and designed to give you the skills necessary for a competitive edge in today’s tough competitive landscape. Understanding the wealth of data provided by your website and your visitors, coupled with systematically rising conversion rates through landing page testing will put you one up over the competition!

Google Analytics – Introduction & User Training
Orange County - Wednesday, April 15
Honolulu – Tuesday, April 21
Boston - Monday, April 27

Day one offers an introduction to Google Analytics and then some. Learn how to turn the sea of web analytics data into information that you can use to make the decisions that drive your bottom line. Day one topics include:
  • Introduction to Web Analytics
  • Common Interface Features
  • Dashboard Reports & Customization
  • Understanding Visitors, Traffic Sources, Content, Goals and Ecommerce
  • Motion Chart Visualization
  • Analytics Best Practices for Branding, Lead Generation & Ecommerce
  • And much, much more…
Google Analytics – Advanced Technical Implementation
Orange County – Thursday, April 16
Honolulu – Wednesday, April 22
Boston- Tuesday, April 28

The second day will show you how to install and configure the advanced features and capabilities of Google Analytics. We'll show you how to use every ounce of this tool with tips and tricks, technical aspects, and how to avoid common problems. Day two topics include:
  • Profiles and Strategies
  • Filters – Uses and Implementation
  • Goals & Funnels - Configuration & Setup
  • Ecommerce Implementations
  • Site Search, Event Tracking, Custom Reporting and Advanced Segmentation
  • And much, much more…
Landing Page Testing with Google Website Optimizer
Orange County – Friday, April 17
Honolulu – Thursday, April 23

Learn how to make the most of the visitors to your site with landing page testing and get hands-on experience in designing, setting up, running, and analyzing A/B and multivariate tests with Google Website Optimizer. The experts will show you how to improve your users’ experience and continually increase your conversion rates through testing. The Website Optimizer Seminar includes:
  • An overview of testing and Website Optimizer
  • How to identify problematic pages and estimate sample sizes
  • Loads of testing best practices drawn from real tests and case studies
  • Hands-on lab experience in setting up, configuring, & launching both A/B and Multivariate tests
  • How to interpret the data and run follow up experiments
Seats are limited, so register today for the April seminars!

Tuesday, 7 April 2009

What are Regular Expressions and Why Use Them?

Regular Expressions (RegEx) are a set of characters you can use match one or more strings of text. The main reason to use Regular Expressions is that they support wildcard matching, letting you capture a lot of variations (in URLs for example) using a single string of characters.

Here are a few examples when Regular Expressions are useful in Google Analytics:
  1. Matching multiple pages when defining a goal or funnel page
  2. Exclude a range of IP addresses when defining a filter
  3. Defining complex advanced segments
  4. Including and excluding multiple URLs from reports such as the Top Content report


Check out this help center article for some basic definitions of Regular Expressions and how they work.

Tips and Tricks

Here are some tips, tricks and flourishes to make your RegEx sing.
  1. USE TRIAL AND ERROR: There is only one really, really good way to write Regular Expressions. You can use all the testing tools in the world, but the only good way is to get them wrong, and then rewrite them and rewrite them until you are sure that they are right. So... be sure to have a profile that you can use just for testing.


  2. KEEP IT SIMPLE: If you need to write an expression to match "new visits", and the only options that you will be matching against are "new visits" and "repeat visits," just the word "new" is good enough.

  3. REGULAR EXPRESSIONS ARE GREEDY: They will match everything they possibly can, unless you force them not to. If your expression is "visits", it will match "new visits" and "repeat visits." After all, they both included the expression "visits." To make them less greedy, you have to make them more specific

  4. DON'T OVER DO IT: (See #3 above.) For example, many people use a Regular Expression only when creating an IP address filter. If the IP address is 6.255.255.255, they create an expression like this: 6\.255\.255\.255 -- and forget that that will also match 26.255.255.255, etc. So in a situation like this, you really do need to start with a beginning anchor, ^6\.255\.255\.255 . A beginning anchor (called a carat), says, "To be a match, it has to start here."

  5. MATCH EVERYTHING WITH .*: Some combinations of Regular Expressions are very special. Perhaps the most useful combination is a dot followed by a star, like this: .* And don't forget about a dot followed by a star, but in parenthesis, like this: (.*) The first one means, get everything. It is your ultimate wildcard. On the other hand, (.*) means, get everything and put it in a variable. You'll find that (.*) is very helpful when you are creating custom advanced filters.

  6. BACKSLASH TO ESCAPE: Backslash is the most frequent RegEx you will probably use. It means, take this special character and turn it into an everyday character. So if you are trying to match to "www.mysite.com?pid=123," you have a problem -- unless you use your backslash. The question mark is a Regular Expression, and only by using a backslash, like this: "www.mysite.com\?pid=123" can you take away its special powers. If you aren't sure whether something is a Regular Expression or not, go ahead and use that backslash -- it won't do any harm.


  7. WHITESPACE IS WHITESPACE: The most frequent question you might ask is, "How do I create a white space with Regular Expressions?" The answer is usually, just use white space. So if you need to match to "Google Analytics," you can make your Regular Expression be "Google Analytics."

Other Resources

Most of the basic Regular Expressions (RegEx) needs are covered in the Google Analytics documentation (you should start here if you want to learn those basics). Watch out though, just because something is not in here doesn't mean Google Analytics doesn't support it.

Other good sources are regular-expressions.info and RegEx Coach, an interactive tool for testing Regular Expressions.

How do you use Regular Expressions? Leave a comment and let us know!

Posted by Robbin Steif of LunaMetrics , a Google Analytics Authorized Consultant

Monday, 6 April 2009

Google Analytics has a variety of features that can help you explore and understand your data. But with so many features, beginners are often baffled at where to start. To help you navigate through the product, we've created the Discover Analytics Checklist which groups features into bite sized chunks. The checklist will keep track of what you've mastered and what you have yet to explore. You can start with "Install Tracking Code" and work your way to the "Advanced Features" or prioritize based on your needs (although, we do recommend you start at "Getting Started"). As an added bonus, you can sigh a self-satisfied 'Ahhh' each time you cross off an Analytics to-do from your list.


We hope this can help you keep track of your steps and give you the reference material you need for implementation troubleshooting tips. We will continue to update and expand this list as new features are launched.


Thursday, 2 April 2009

On the Analytics blog, we spend a lot of time talking about bounce rate. The bounce rate is defined as the percent of users who leave your website after viewing just one page (Single Page Access / Entries). There's been a new development in AdWords that could help lower your bounce rate for display ads, while giving you more granularity into which segment or area of an ad visitors tend to click on.

With the new Rich Media and Video templates in the AdWords Display Ad Builder, you can now show off several products and define multiple destination URLs, all within the same ad. Using Google Analytics, you can add tracking parameters to the end of each destination URL, telling you exactly which items users found to be most interesting in the ad. This will give you insights on your creative, such as which items to focus on and how prominently they should be featured in the ads.

Here's an example: You're selling multiple kinds of shoes, each with a different landing page. You upload images of 4 different shoes to a rich media template, and define a unique destination URL for each, adding Analytics parameters. You run your ad on the Google content network and using Google Analytics, you see that Shoe 3 was the most clicked. You can now alter your creatives for other display ads to focus more on Shoe 3. Your click through rates for your ads increase, and your costs per conversion decrease.

To learn more about these templates and the display ad builder tool, take a look at our post on the AdWords blog.

Wednesday, 1 April 2009

We are intrigued and only vaguely fearful to announce that after just half a day's tracking the reports from CADIE's homepage and other web properties suggest rather forcefully that the world is not yet entirely acclimated to her post-Web 2.0 design and content sensibilities. Yes, CADIE's pages have received an impressive number of visits in the past eighteen hours. But average time on site is a less than impressive twelve seconds, and 99.8% of visitors are immediately "bouncing" (by which in this case we mean leaving the page in stunned, incredulous horror) rather than exploring any further. Notice also the unprecedented -99% change in average time on site. We're at a loss to explain how it is that users are actually spending less time on CADIE pages today than they were yesterday, when the sites didn't actually exist, which we would have thought theoretically impossible and frankly are still kind of freaked out about in a future-Clark-Medal kind of way.

Where did CADIE go wrong? The content report for her homepage offers one adorable, annoying clue: pandas. CADIE gets lots of traffic on the top three pages but 99.8% bounce rates, 99.8% exit rates and 0 $Index value indicate that her thematic priorities and idiosyncratic design execution are scaring almost everyone away. We say "almost" because, it must be acknowledged, .2% of her visitors do seem to enjoy her (obsessively panda-related) content. We'll examine this segment momentarily, but first here's her content report.


We isolated the .2% CADIE traffic that seems to respond to her content. Take a look at the list of browser/platforms in the report below. It's kind of heartbreaking, actually, but it seems that CADIE's only high-engagement visits come from -- CADIE herself! We can only surmise, with considerable interest and a slightly higher level of fear, that she has been clicking away at her own site. Admiring her work, if you will.


Now if you'll excuse us, our electronics are starting to act a bit strangely so we're going to have to power down, gear up and run off to British Columbia, where we intend henceforth to live off the grid, and off the land. Good luck to us all.